DAY TRADING DECRYPTED
Day Trading Decrypted is Chart Raiders' free technical analysis course — the deepest day trading science ever published. The Game of Skill foundation behind Day Trading E-Sports and gamified day trading. Free to every Fantasy Trading competitor, forever.
Day Trading Decrypted is Chart Raiders' free technical analysis course — the deepest day trading science ever published. The Game of Skill foundation behind Day Trading E-Sports and gamified day trading. Free to every Fantasy Trading competitor, forever.
A Note from c0tt0nc4ndyta
A Note from c0tt0nc4ndyta — personal letter, not factual. "I didn't invent the knowledge. I reverse-engineered it — and then I spent a decade giving it away for free."
This documentation exists to create an official, structured reference for the science I have been teaching publicly for over a decade. My career as c0tt0nc4ndyta has been built entirely on one purpose: spreading the knowledge about the science of the markets and sharing the journey I went on to educate the world — for free. Every lesson in this book, every chart, every rule, reflects years of live teaching, thousands of hours of sessions with traders at every level, and an unrelenting belief that this science belongs to everyone who is willing to learn it.
This documentation is also the bridge to my next stage: Chart Raiders — the world's first Gamified Day Trading platform. Chart Raiders brings this science to life as a game of skill, built around fantasy trading. It is the natural evolution of everything this course teaches. Visit www.chartraiders.com to download it free.
Today is March 18th, 2026, and I created this framework approximately ten years ago by reverse-engineering charts that have existed since the 1800s. The patterns were always there — embedded in price structure that predates modern trading by more than a century. I did not invent these patterns. I systematized them. I built a language for them, a set of rules, and a repeatable process for applying them — and then I taught that process to anyone who would listen. The science belongs to the markets. The markets belong to everyone. What I own is this specific framework: the names, the system, the structure of the rules, and the way they are applied. This book and its contents are mine. The underlying knowledge of how markets move has always been yours.
Day Trading Decrypted is the product of what I estimate to be fifteen to twenty years of this reverse-engineering work — tens of thousands of hours of public teaching, thousands of private mentorship sessions, and ongoing daily feedback from a global community of traders. The system you are reading was not built in a classroom or constructed from existing trading literature. It was extracted directly from charts: real price data, real patterns, real confirmations and failures. The goal was never theory for the sake of theory. It was always a repeatable, logic-based system for reading charts at the highest level of accuracy the science allows. That is what this course is.
Every rule in this system is valid. Every tool covered in this book works. But they are tools — and the right tool must be applied to the right situation to produce accuracy. This science is not a checklist where every rule applies to every trade. It is a toolkit. The depth and complexity of what you will learn means that part of mastering this system is learning which tool the current chart calls for. A chart showing a clean ladder requires different application than a chart working through a Pandora's Box. A trade entering at an Origin Level reads differently than one entering at a RAT. The rules do not compete with each other — they each have a context. Your job is to identify which context you are in, and apply accordingly.
Every theory in this book applies equally to both sides of the chart. If a rule governs how a Hold Level behaves on the top side of a move, that exact same rule applies to a Hold Level on the bottom side. If a Combo Level chain drills down to a precision entry on the upside, it does the same on the downside. The chart is a mirror. Every concept, every level type, every structural rule — they are symmetrical. When you learn one side, you have learned both. This is not a shortcut: it is a mathematical property of how price structure works. Let that symmetry simplify your analysis rather than complicate it.
Every lesson in this course has a corresponding video for those who learn better visually. All videos are available inside the Chart Raiders software — free to access, free to download, free to use. You do not need a paid subscription to learn from this material. Go to www.chartraiders.com to download Chart Raiders and access every video lesson alongside this written documentation.
Chart Raiders
The world's first Gamified Day Trading Experience — Skill Based Fantasy Trading
Glossary & Cheat Sheet
These are the c0tt0nc4ndyta system terms — the core language of Day Trading Decrypted. Every occurrence throughout all lessons is highlighted in this exact color. Nothing else in the document uses cyan.
0 - Intro
Welcome to Day Trading Decrypted. Created by myself, c0tt0nc4ndyta. Eight years ago I published my first version of the day trading sciences, and ever since I've published thousands of hours of videos, built a community of hundreds of thousands of Day Traders, and become known as one of the most accurate Day Traders in the world. I've collected daily feedback by the dozens and used it to create this final master course — Day Trading Decrypted. It will act as a training guide to give you the best possible foundation as a Day Trader.
The course is organized into five core sections. Technical Analysis covers the six core pillars of what we mark on the charts, followed by mastery-level add-ons that can be applied to any of those six theories. Mental Analysis covers how to keep a healthy and disciplined mind to reach the highest level of success. Logic Flow builds the ability to understand and chart at a deeper, more structured level. Comparative Analysis covers how to make decisions on the chart once a trade is entered. As a bonus, the Drills section provides tools to refine mechanical trading skills and sharpen reaction times.
Day Trading Decrypted is built on a single premise: day trading charts follow a mathematical, cyclical science that can be reverse-engineered. This course is the product of over 15 to 20 years of that reverse-engineering work — tens of thousands of hours of public teaching, thousands of private mentorship sessions, and ongoing daily feedback from a global community of traders. The goal is not theory for the sake of theory. It is to give you a repeatable, logic-based system for reading charts at the highest level of accuracy the science allows.
The course is organized into five sections. Section One covers the six core pillars of technical analysis — the foundational marks that every chart requires. It also introduces mastery-level add-ons that layer additional precision onto those six core pillars. Section Two covers Mental Analysis: the internal and external disciplines required to trade without emotion. Section Three is Logic Flow — the most advanced section of the course — where all prior knowledge is combined into a structured decision-making process. Section Four covers what to do after a trade starts. Finally, Section Five contains ongoing drills to sharpen execution speed and pattern recognition.
The Skill Check contains integration lessons that demonstrate how to use all the theories covered up to that point together in a real charting context. That integration lesson is critical. Do not skip it. The science only becomes usable when the individual pieces are combined.
The cheat sheet accompanying this course is organized into five categories. The first — marked in Red — covers everything we mark on the charts: the six core pillars of Section One. The add-on system is worth understanding from the outset. At any point in charting, a single level can carry multiple labels simultaneously: a Hold Level that is also a plus-one, that is also polarity, that is also a floating level. Each label adds a layer of context. The add-ons are not separate from the core six — they are precision modifiers applied on top of them. The more add-ons that stack on a single level, the clearer the picture of what that level means.
The second category — marked in Pink — covers Mental Analysis and industry terminology that does not directly affect the science, but is useful for communicating with other traders and for maintaining the healthy, disciplined mindset required to reach the highest level of success. The third category — marked in Yellow — covers the most advanced ways to combine logic with charting to create high-quality opportunities to buy and sell. The fourth category — marked in Teal — introduces the first steps toward Comparative Analysis, serving as an introduction to a much deeper mastery-level topic. The fifth category — marked in Orange — provides tools to refine mechanical trading skills through focused drilling.
The color pattern used in this system is called Neon Bones. Each timeframe is assigned a specific color to make identification instant at a glance. When you see a color on the chart, you immediately know its timeframe without reading a label. The chart below shows the full color map.
The science presented in this course has existed in day trading charts since the 1800s — oil charts, gold charts, any historical data set will show the same patterns. It was not invented here. What this course represents is the decoding of a system that has always been present in the charts, used by those who understood it and largely hidden from those who did not. The purpose of this course is to make that system fully transparent and learnable by anyone willing to apply the necessary discipline.
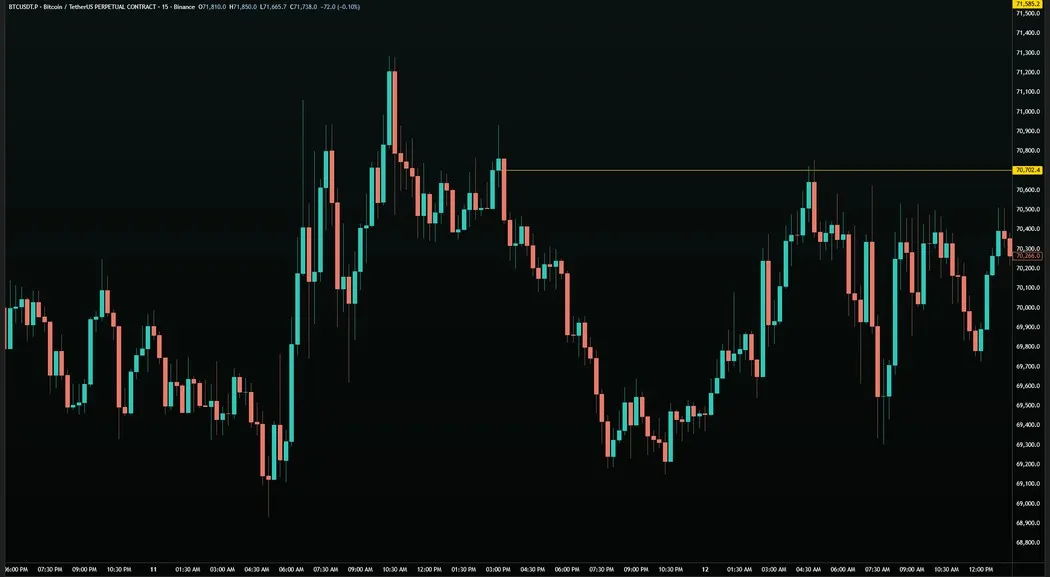
01 - Hold levels
Why not this wick of this move? Why not this green candle? Why not this one? Why not that one? To put it simply, we have two types of levels on our charts. We have Break Levels, which are the wicks of multiple candles in a row, and we have Hold Levels. A Hold Level's job is to hold the price of your trade. This Hold Level held us up, and then we kind of went back and forth between this and another Hold Level, which is another theory for a more advanced lesson called Pandora's Box. We'll get into that later on.
The backside is always going to be at least two candles of the same color. Remember Hold Levels on the bottom can only be red, so that means a backside Hold Level has to be two consecutive red candles at the bottom of the move. The wick of the first red candle in the sequence is called the backside Hold Level. Why this is important is for future lessons where we talk about Break Levels, where we talk about Polarity, and where we talk about testing backsides, Inverse Levels, etc.
- If you are interested in longing, you are always going to be attaching it to the body or the wick of the red candle on the bottom, or green on the top. The general rule of thumb in day trading is that everything needs to be tested once. This rings through no matter which science or which version of day trading material you are using. When a level is tested, it is tested.
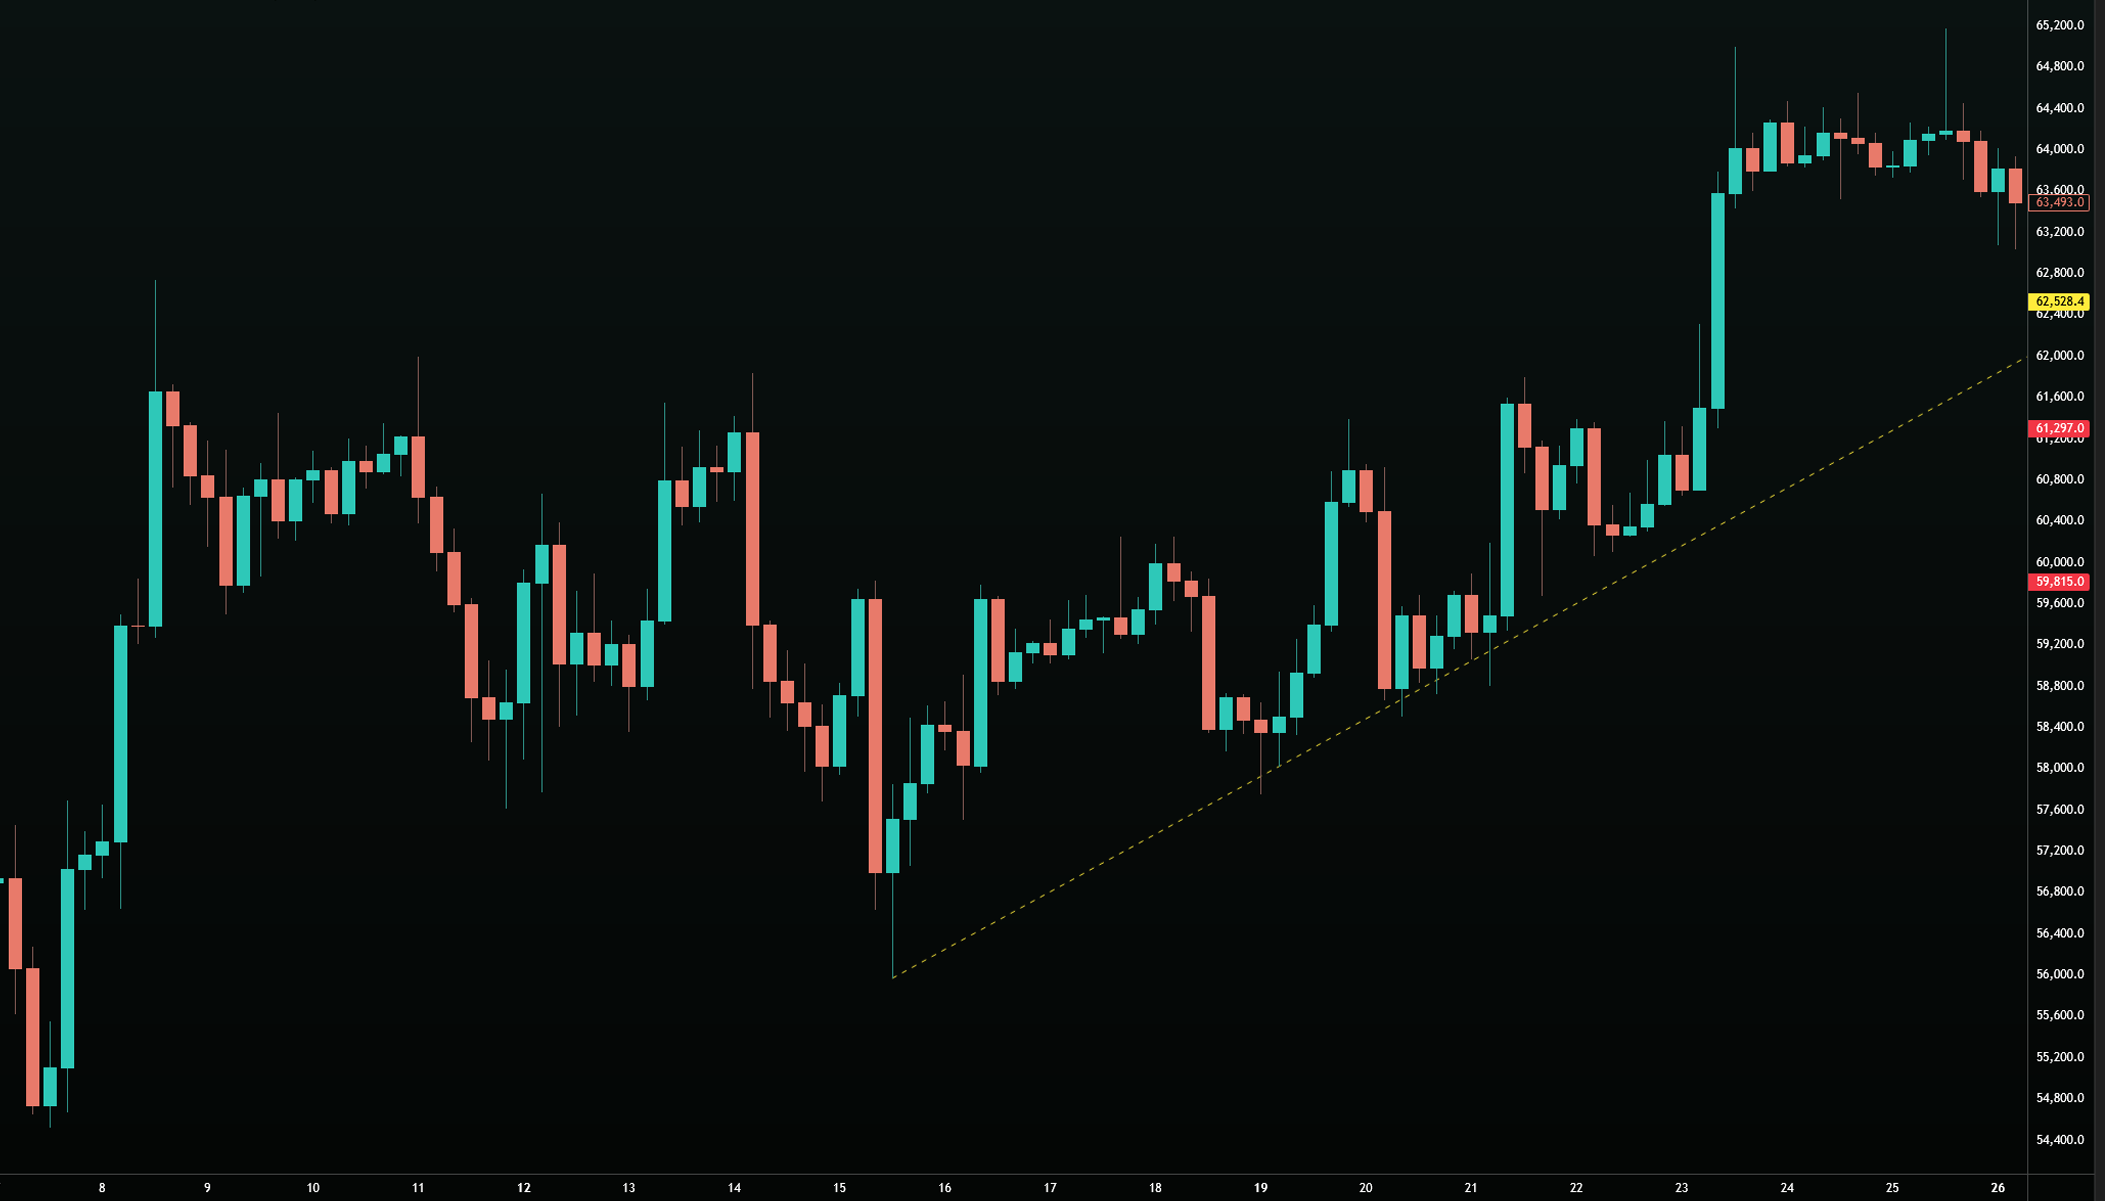
- Whenever you're looking at your charts, you're going to have to go and mark what we call Hold Levels, which you just learned about. A Hold Level is going to be the wick or body of a final candle in any kind of valley or peak — a valley being on the bottom side as a V pattern, and a peak being on the top side as an upside down V pattern.
- A Hold Level's purpose is to protect what we call Break Levels, because you are either breaking the move or holding the move — which we'll go over in the next lessons. The front side, which we simply call Hold Levels, are the final body of the top side of a red candle on the bottom, or the final body of the bottom side of a green candle on top.
- A backside Hold Level is two consecutive candles of the same color in red, as to where the front side Hold Level is simply referred to as just a Hold Level. If you're on the bottom of the chart these are red, and green if you're on the top side of the chart.
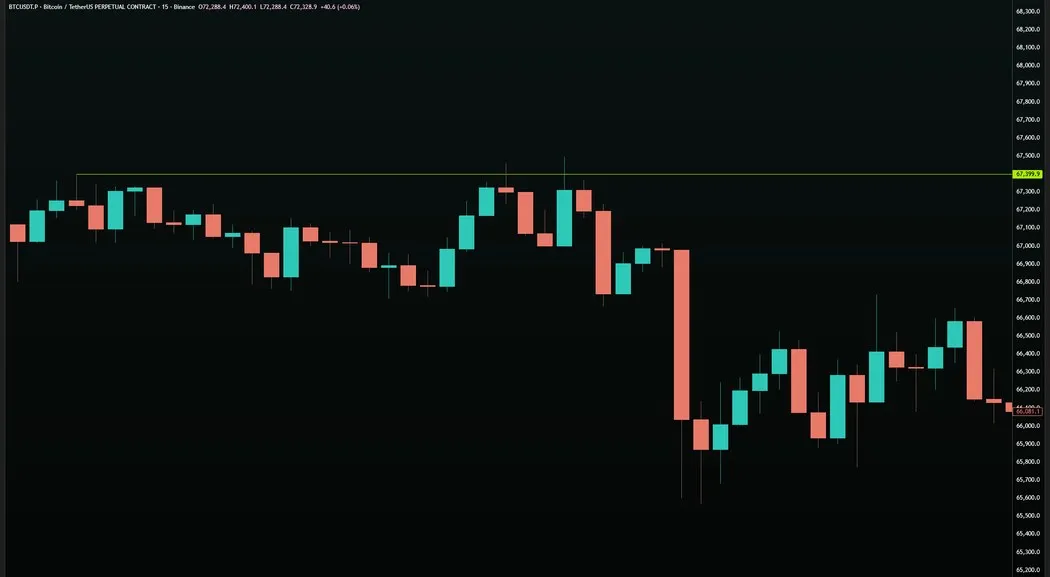
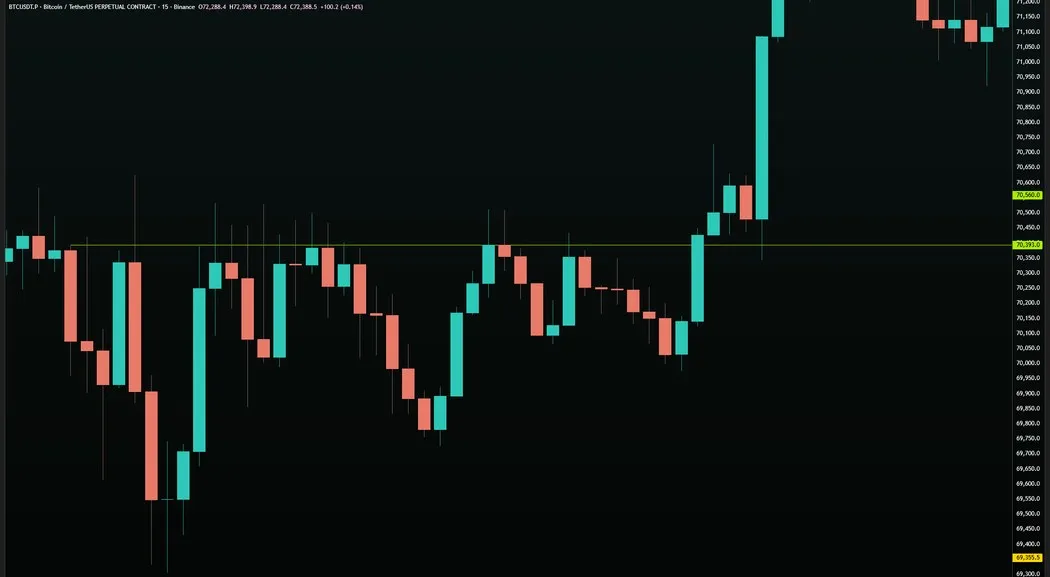
A Hold Level is the body of the deepest red candle at the bottom of a valley, or the body of the highest green candle at the top of a peak. It is defined by the body of the same-color candle in the sequence — the one that has gone the furthest in the direction of the move.
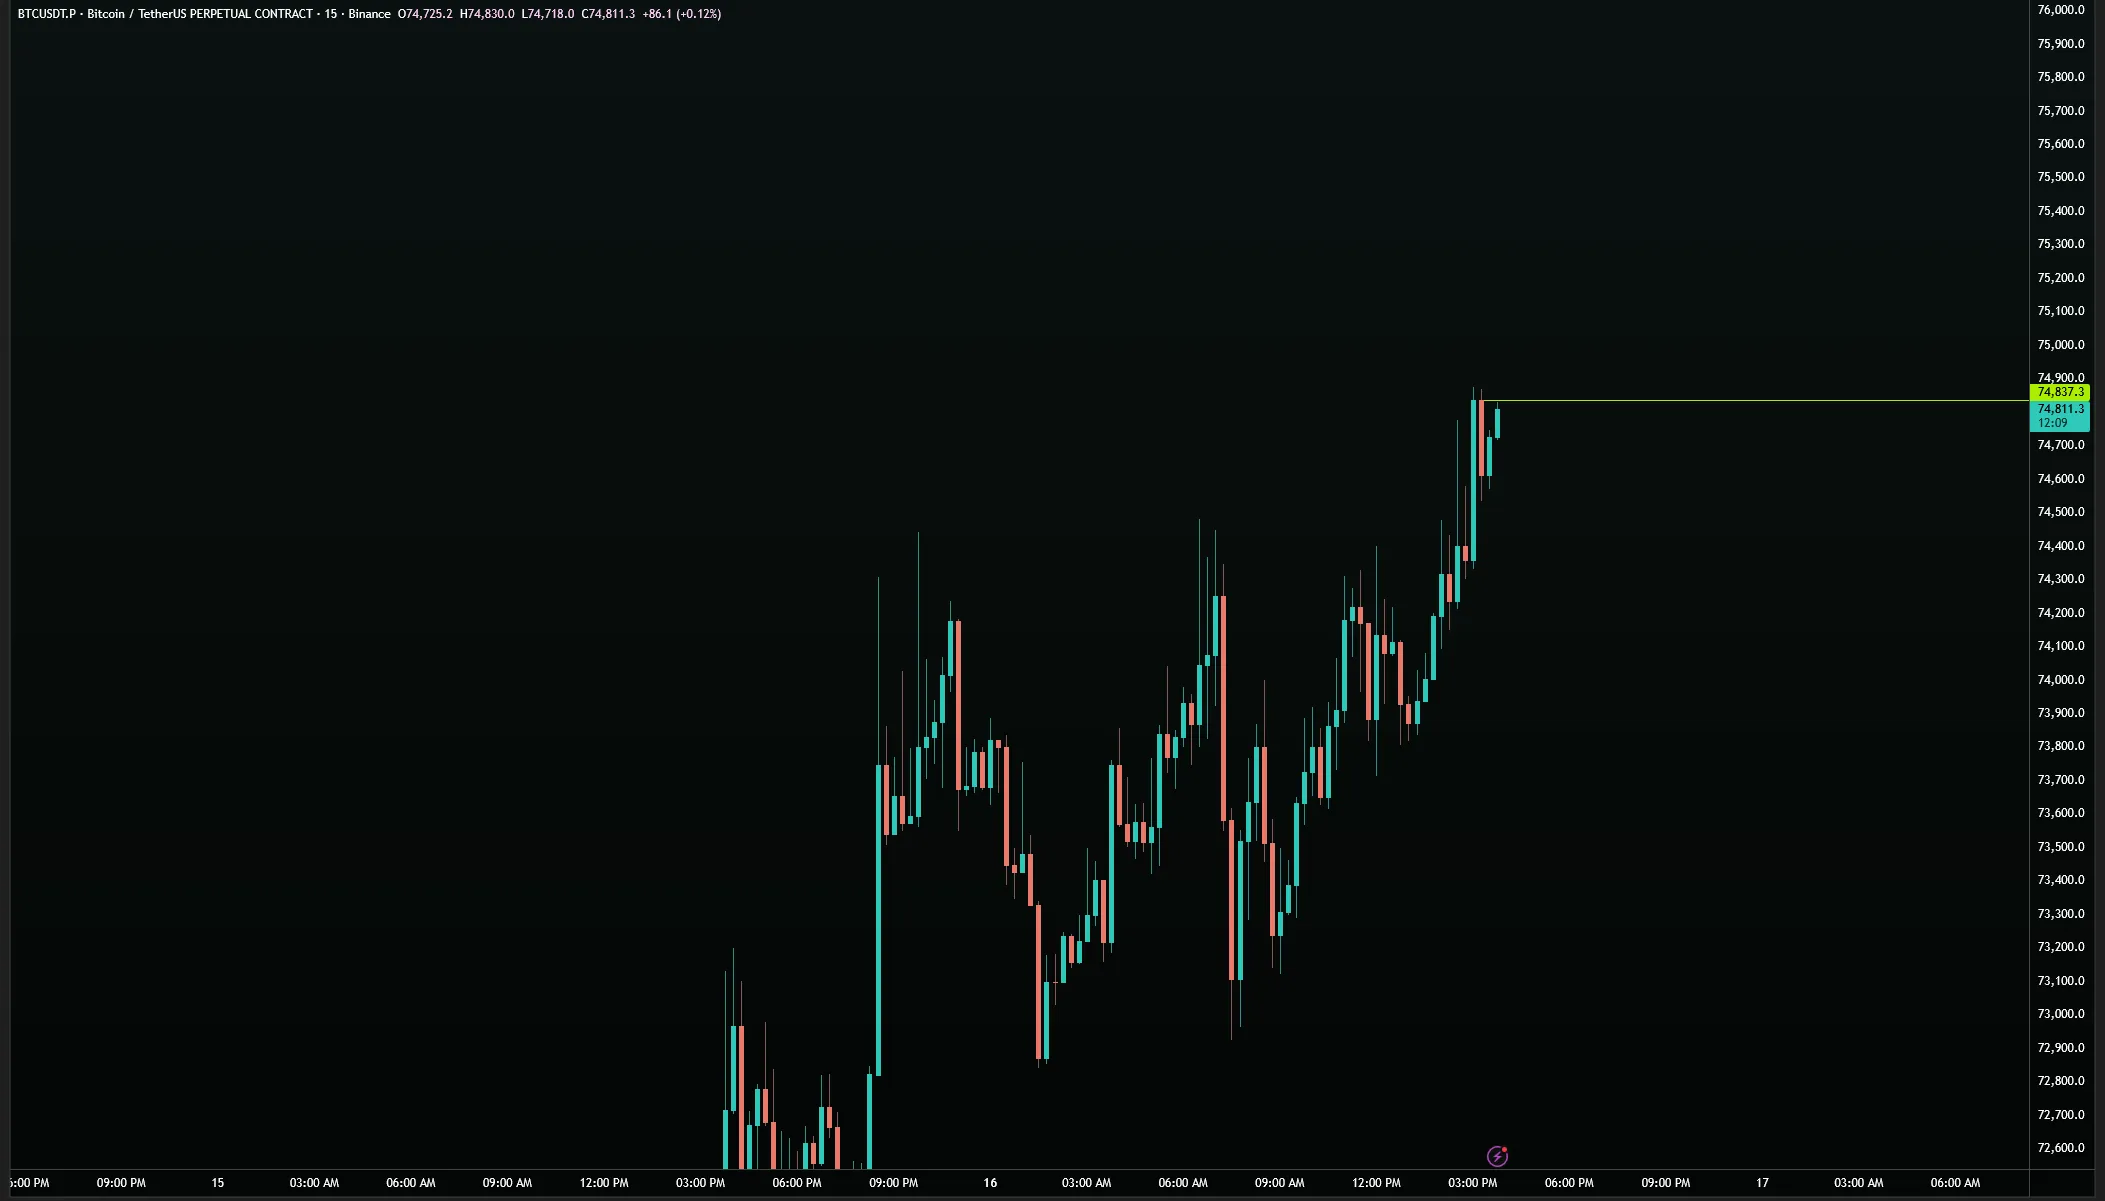
Red candles mark downward price movement. Green candles mark upward price movement. On the bottom side of a chart — in a valley — the Hold Level will always be a red candle. On the top side — at a peak — it will always be a green candle. The greediest part of the Hold Level is not the wick of the most extreme candle. It is the body. That body represents the point where price is being held and projected to continue in the same direction. The wick is still a test of a Hold Level, however it is the highest price point of that same Hold Level.
The function of a Hold Level is precisely what the name implies: it holds price. When price moves down to a Hold Level at the bottom of a valley, the level's job is to hold the move up and continue pushing price in the same direction — higher. When price reaches a Hold Level at the top of a peak, it holds the move down and continues pushing price lower. A Hold Level is not a reversal signal. It is a continuation signal.
Every level in this science is either tested or untested. There is no middle ground. A level is tested the instant price reaches the exact price point — body or wick. If price reaches $87,450.01 and the level is at $87,450.00, the level is not tested. There is no "close enough." This binary rule — tested yes or no — is foundational to everything else in the science, because whether a level is tested or untested determines all downstream outcomes.
The reason the tested/untested distinction matters so deeply is that this science operates like a decision tree. When a level is tested, it removes certain future outcomes from the chart. When a level remains untested, those outcomes remain possible. Accuracy depends entirely on knowing which outcomes are still live on the chart and which have been eliminated. Any ambiguity about whether a level was truly tested introduces errors that compound downstream.
Hold Levels have two components: the body and the wick. Both represent the same level. Whether price hits the body or the wick of a Hold Level, the level has been tested. The body is the greedier entry point — it guarantees you are at the best price. The wick of the same candle extends slightly further and represents the safest possible entry, as the level is considered tested but you're paying a premium versus the body of that same candle. It's a balancing act — the maximum price distance you can achieve while still being within the same Hold Level. Both are valid. The choice between them depends on whether you prioritize entry certainty or entry quality.
A Hold Level has three structural components. The first is the front side wick — the extreme wick of the deepest candle. The second is the front side greediest spot — the body of that same deepest candle. The third is the backside Hold Level — this is defined by at least two consecutive same-color candles in the sequence. The backside is not the second-most-extreme candle. It is the candle that started the run of consecutive same-color candles that eventually created the deepest point.
The backside of a Hold Level requires at least two consecutive candles of the same color. If those consecutive candles are interrupted by a candle of the opposing color, the sequence is broken. A new sequence begins after that break. The backside is always the candle that started the most recent unbroken consecutive sequence — not the highest or deepest candle overall.
Hold Levels are the protection mechanism for Break Levels. Most peaks and valleys have a Hold Level protecting a Break Level on the other side of the move. Understanding this relationship — that Hold Levels hold price in a direction while Break Levels exist to break price in the other direction — this is the fundamental logic of the entire system. Hold Levels and Break Levels are almost always paired. They are the two sides of every move on every timeframe.
Marking Hold Levels on any chart will immediately reveal the direction of the move. If every Hold Level you mark continues to be tested and respected, price is continuing in that direction. The moment a Hold Level fails — meaning price moves through it without holding — it is a signal that the move is under pressure. Multiple consecutive Hold Level failures indicate a direction change is underway. This is the first and most fundamental piece of information the science provides.
02 - Break levels
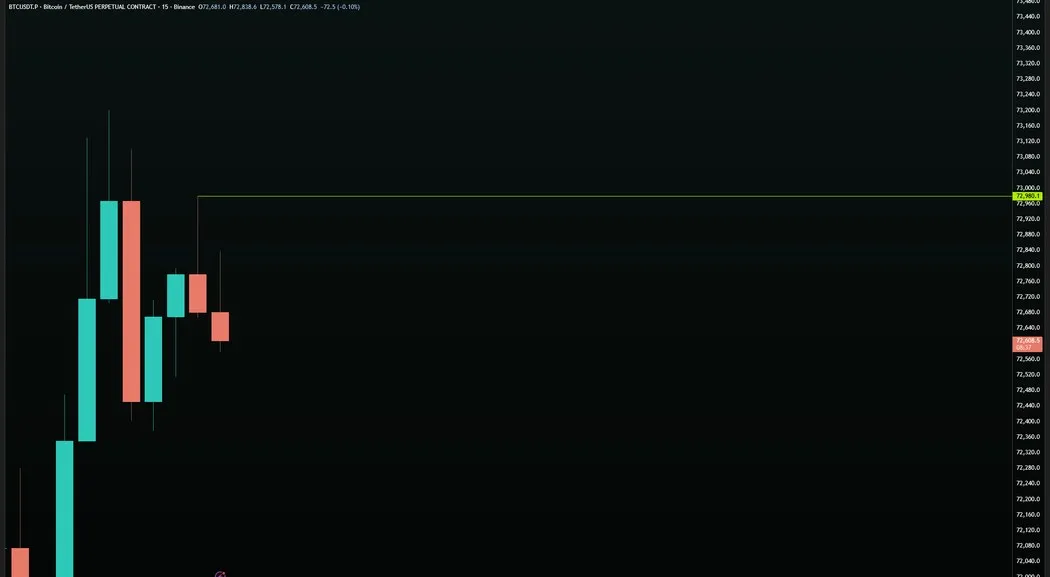
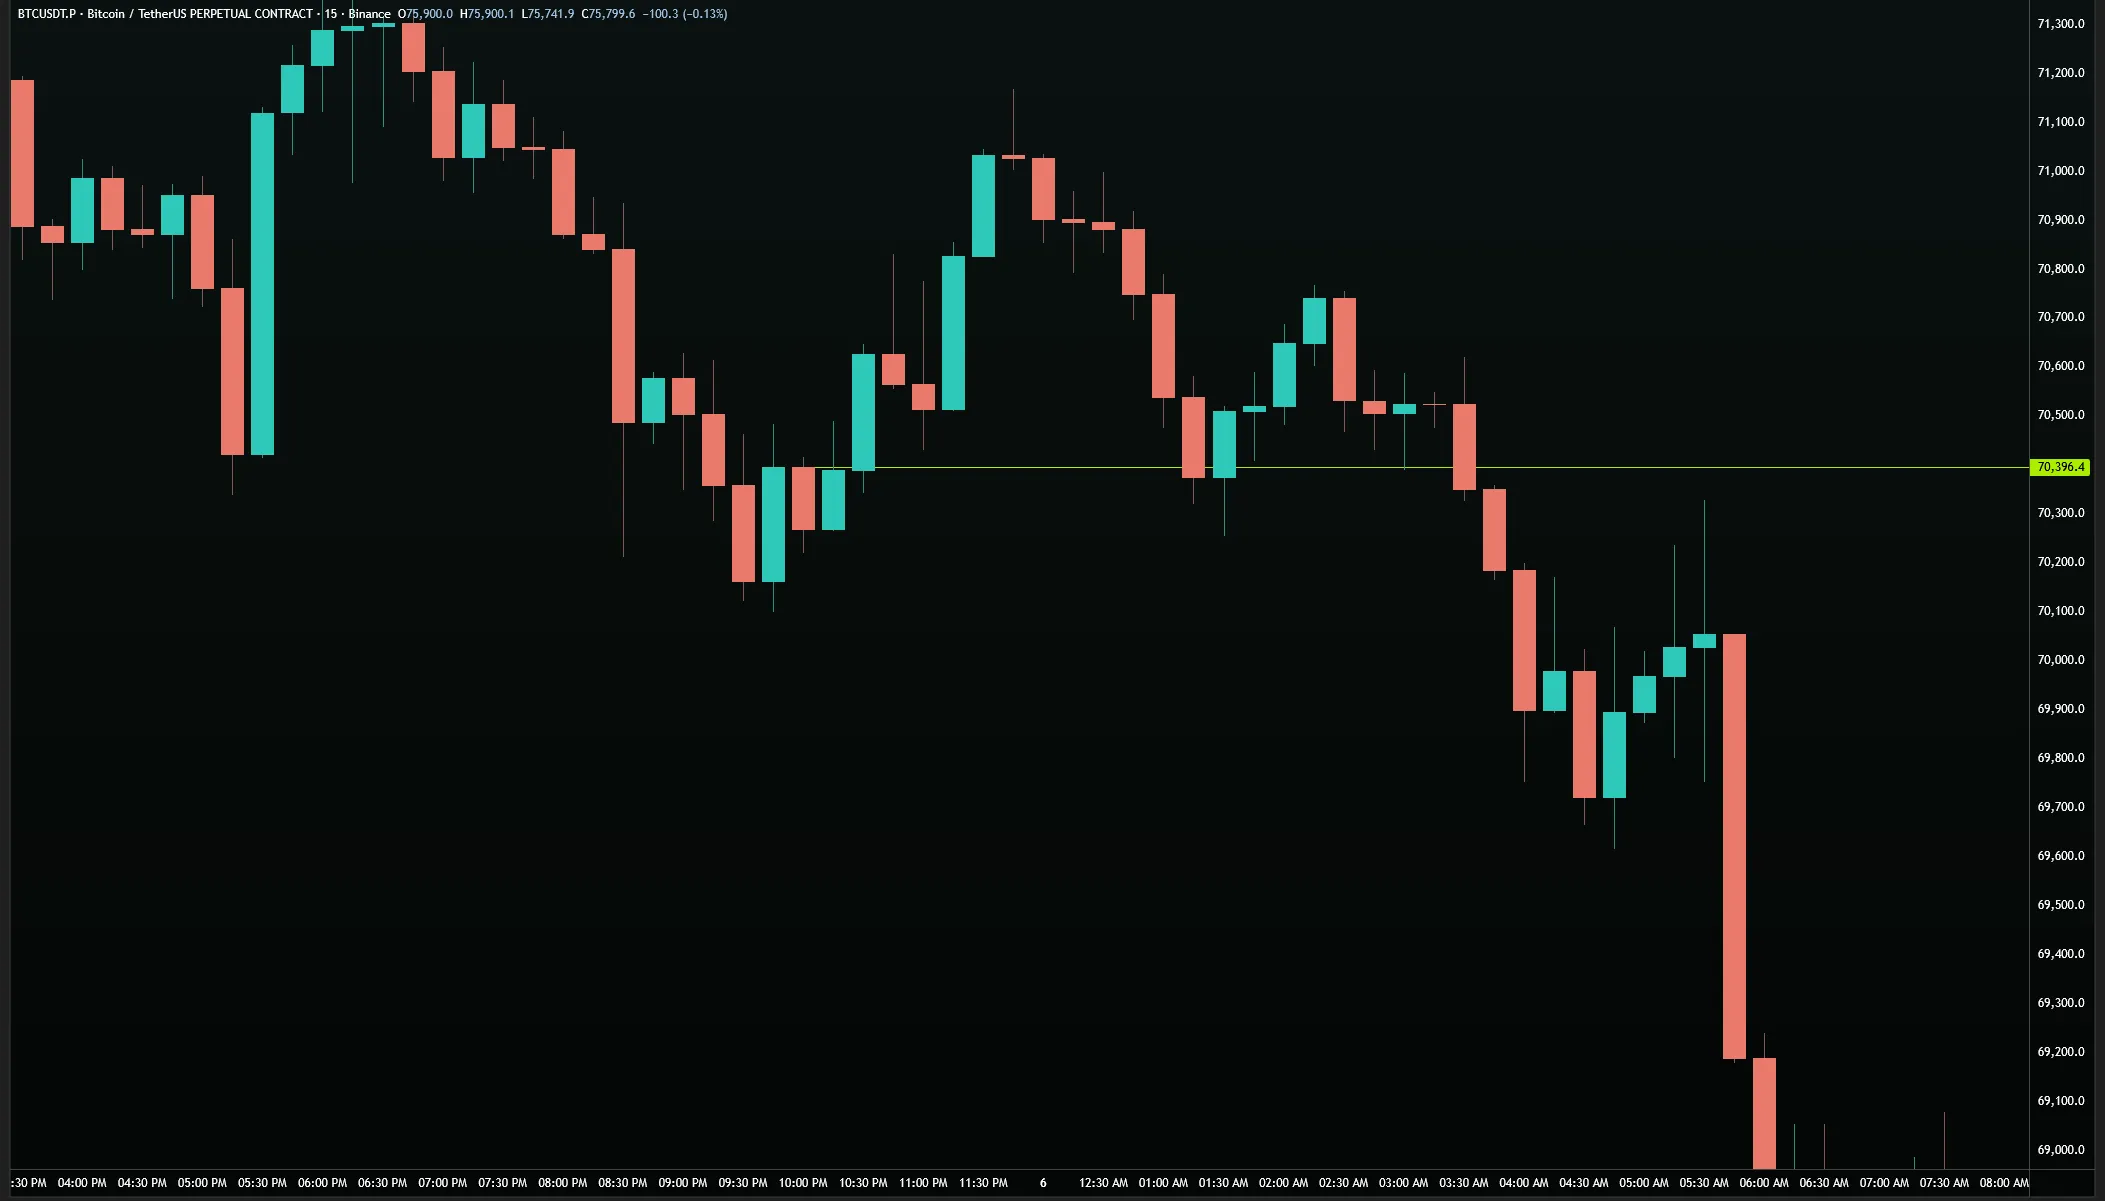
Break Levels are going to be the parts of the chart that break the move. Therefore, their name Break Levels are important. When I created the science, I just wanted it to be simple and I said, hey, let's just call them Hold Levels because they hold price up. Okay, well then if they hold price up, what breaks price down?
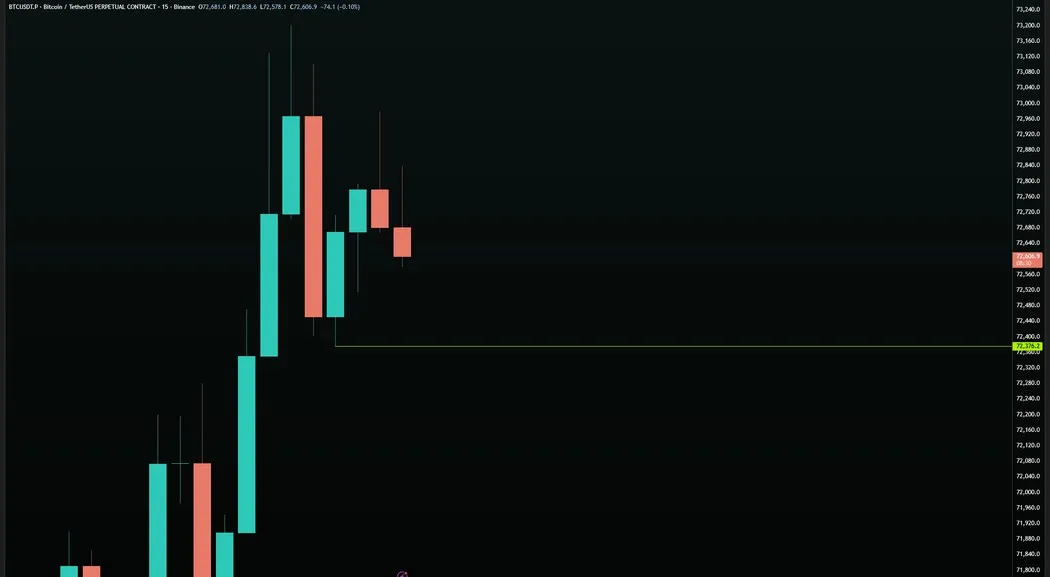
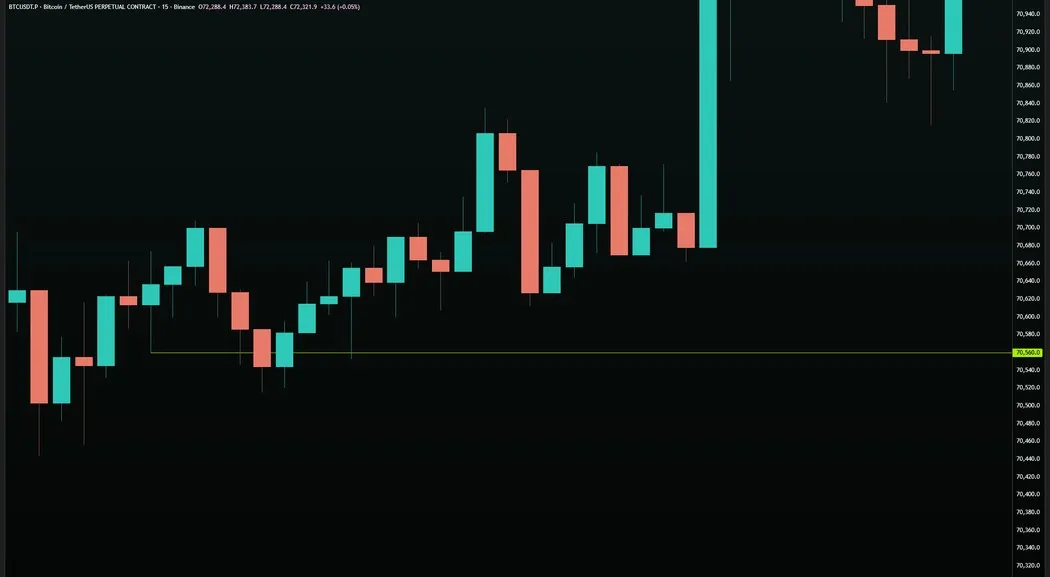
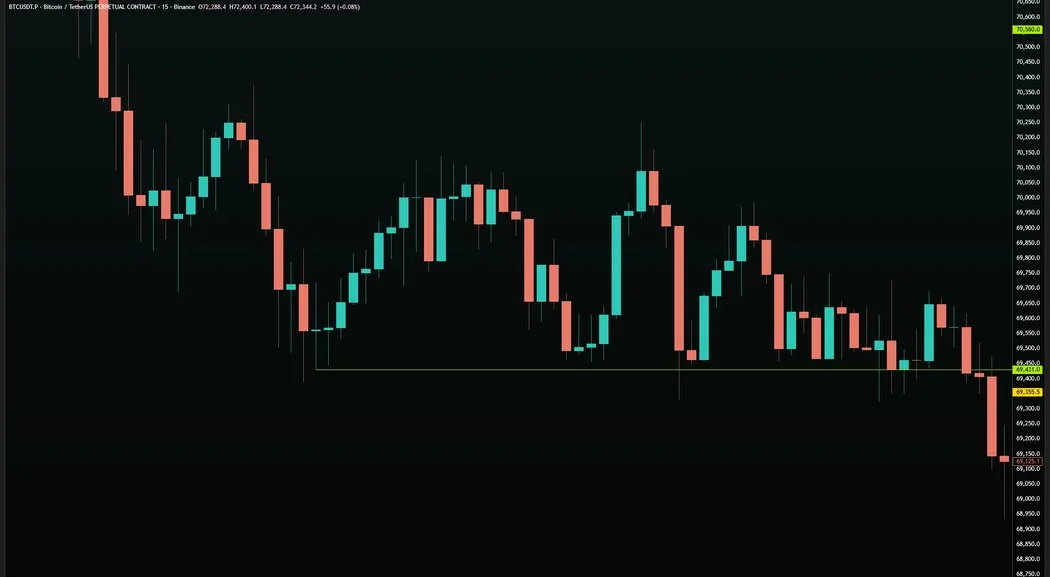
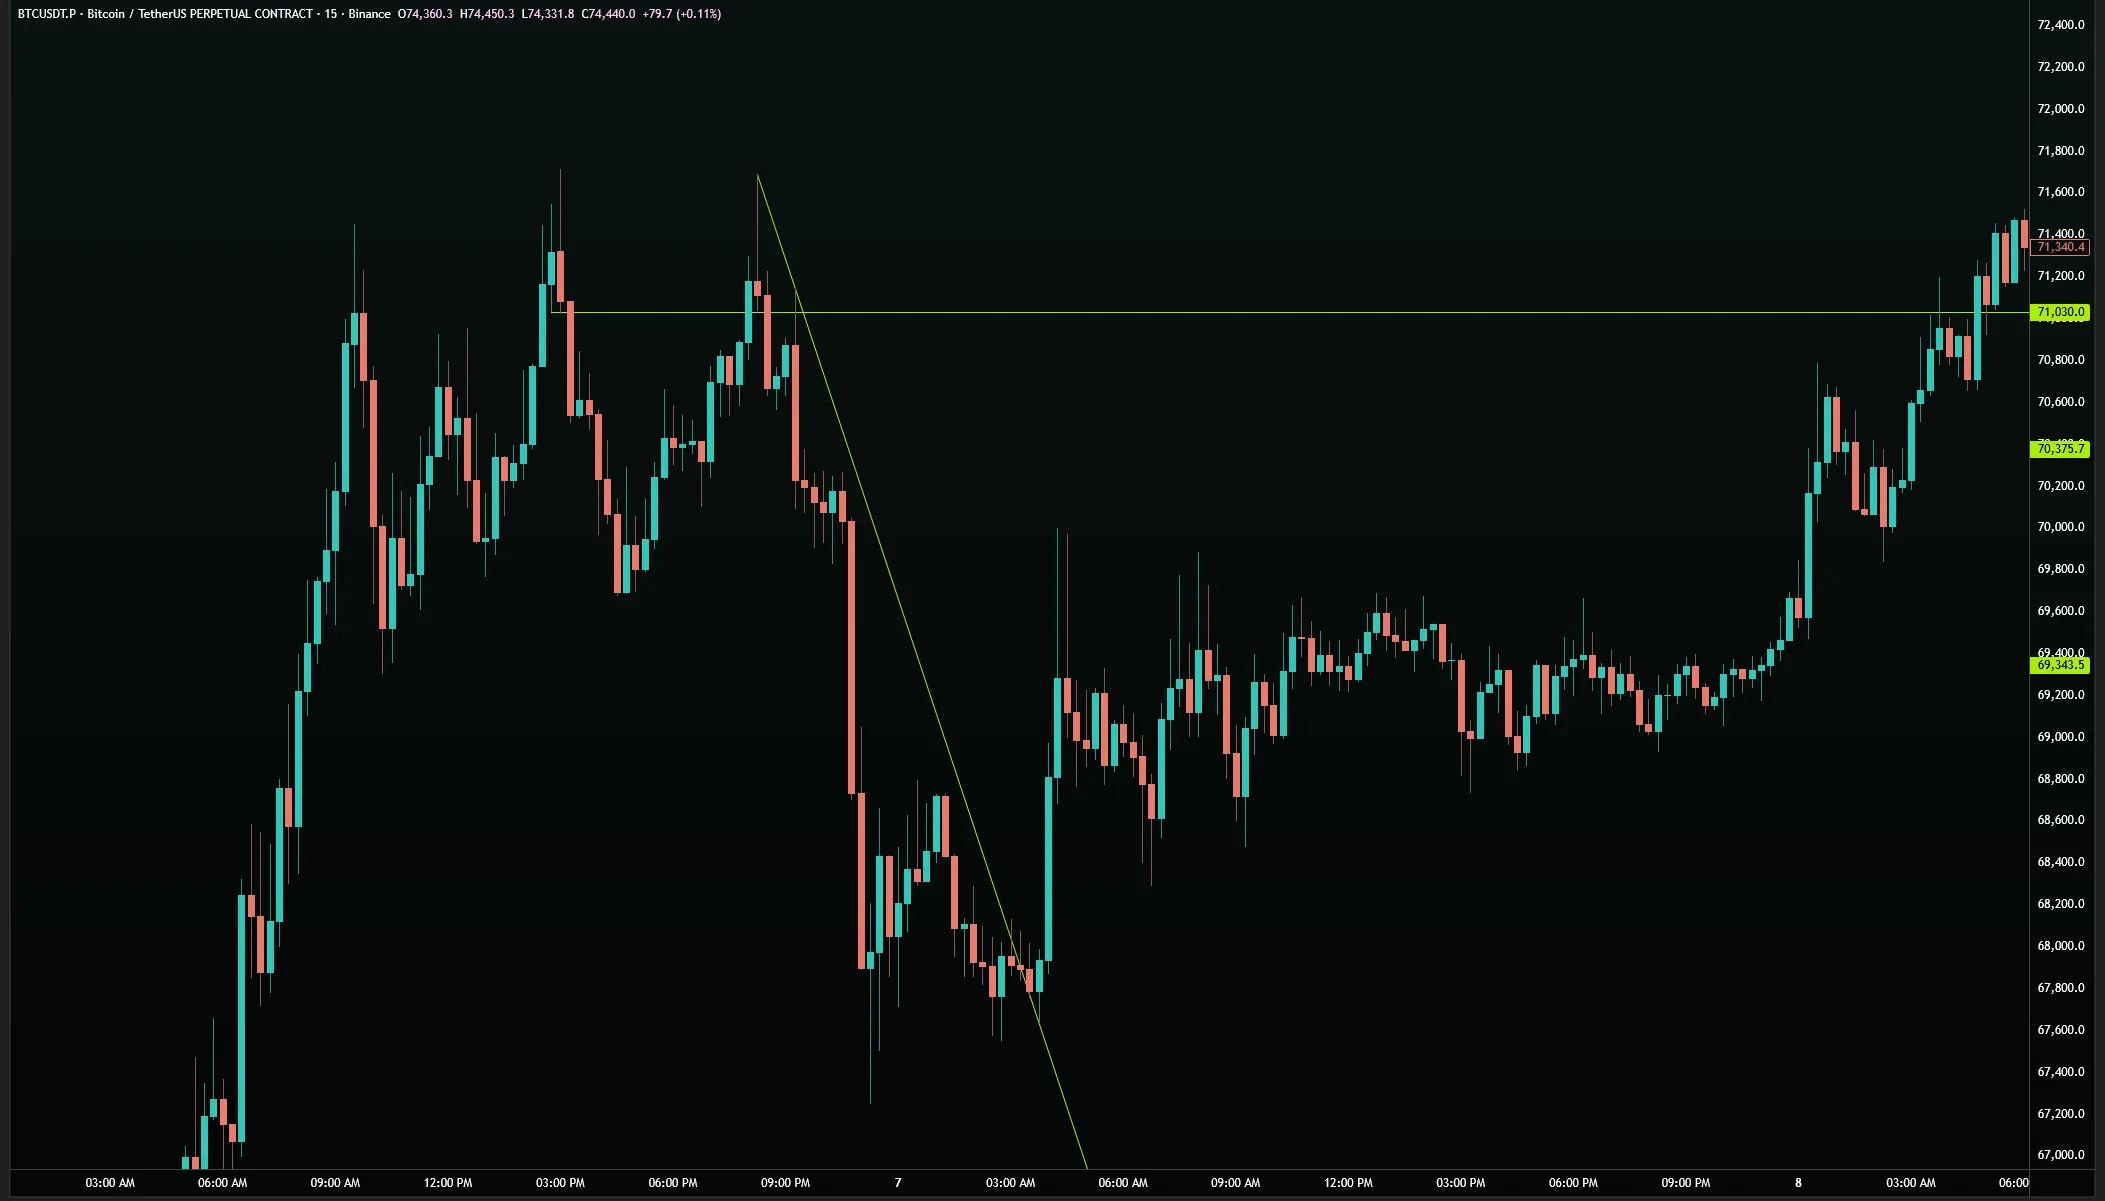
If Hold Levels are the ones that hold the price up or down, your Break Levels are going to be the ones that break the charts. On your screen right now, what you are seeing is you are seeing a Break Level below price.
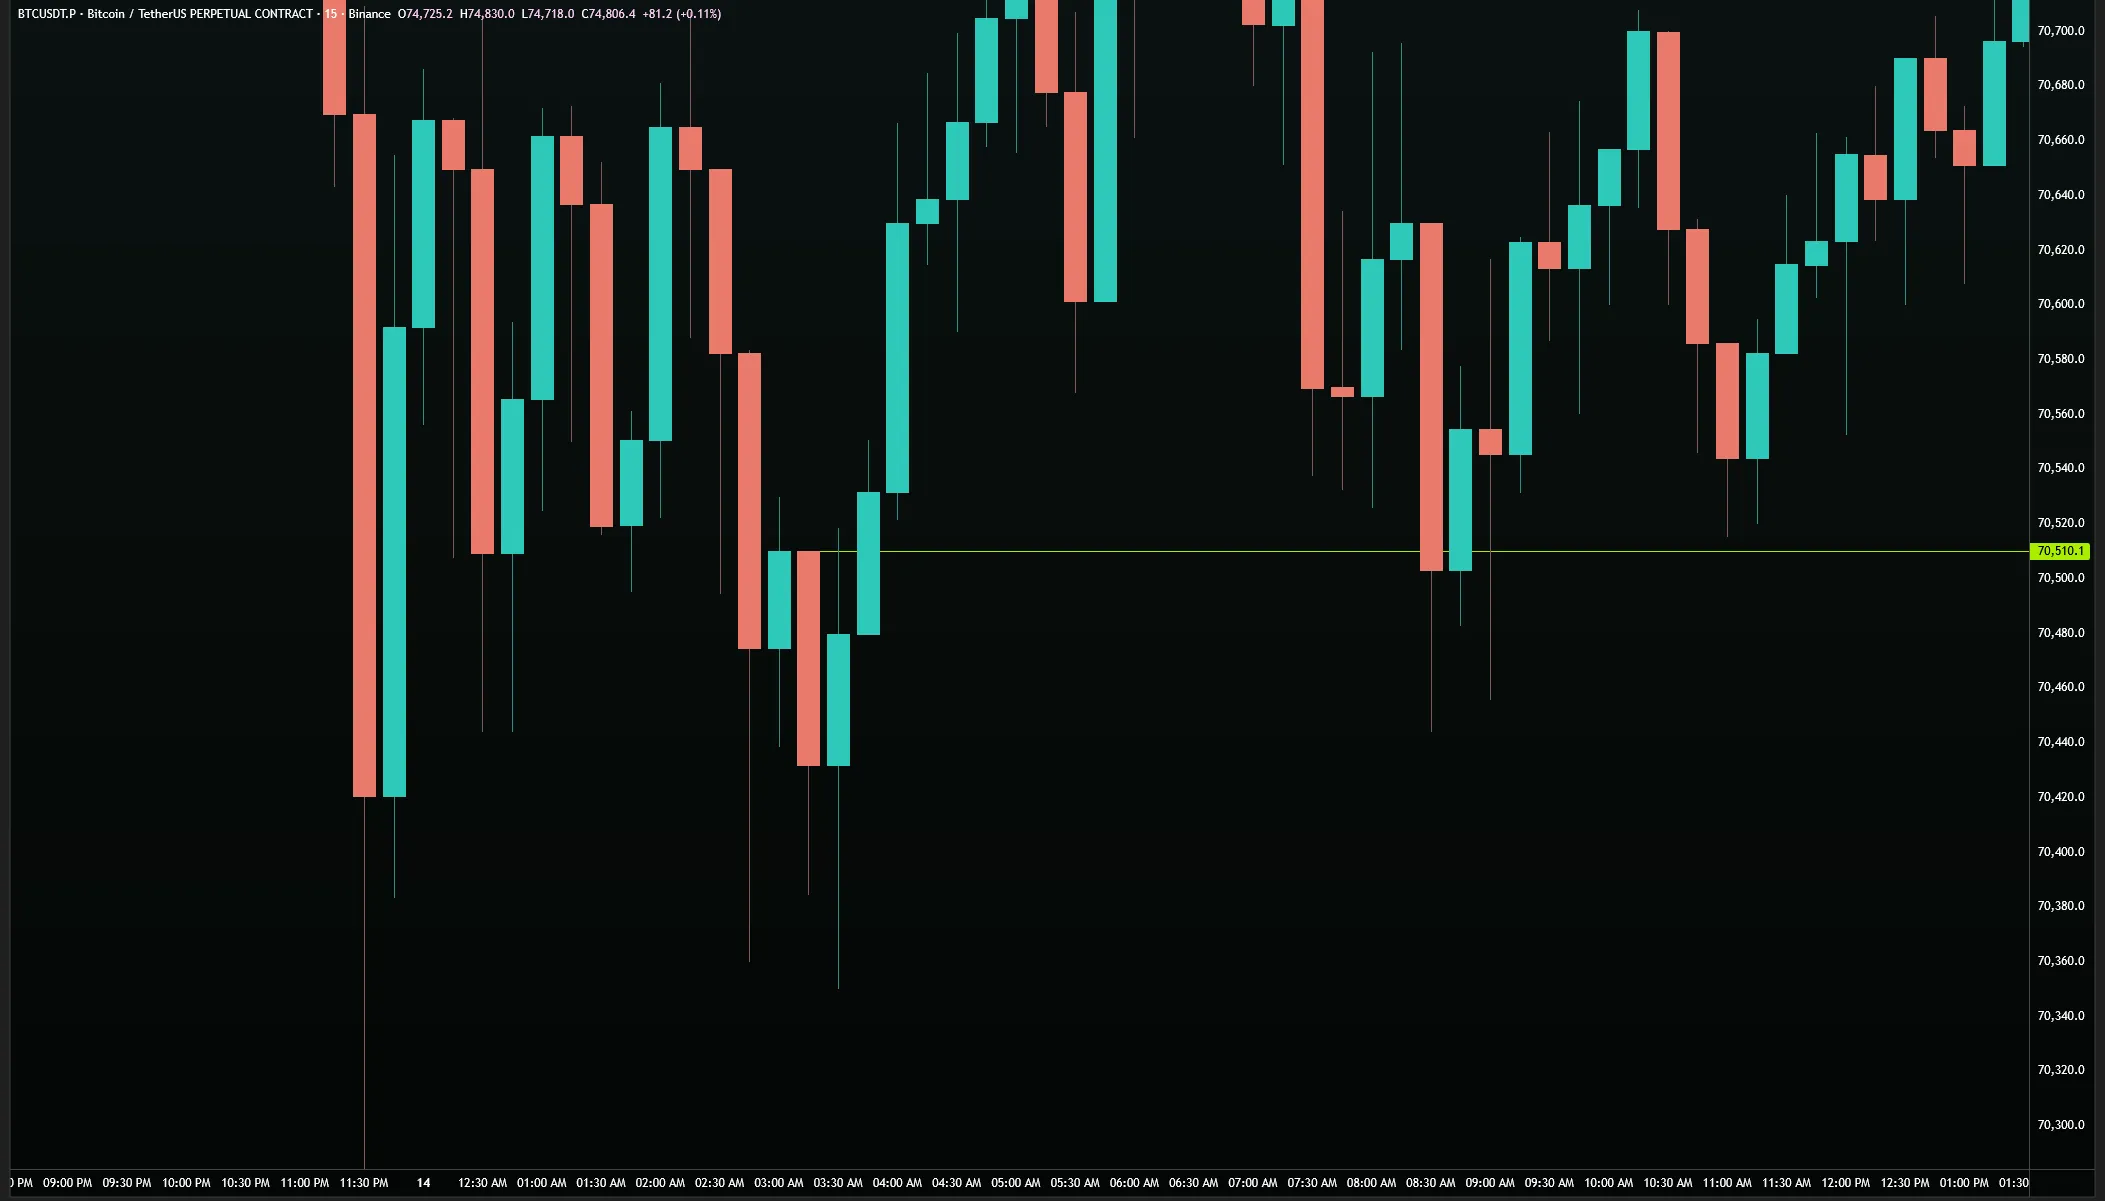
The level at $72,376.2 sits below a rally sequence — this is a Break Level below the price. Green candles formed this level as price moved up. The Break Level marks the point at which price will need to test to start breaking down and begin reversing. Notice the level sits at the wick of the lowest candles in the sequence.
Let's start simple, this is only lesson two so let's just discuss Hold and Break Levels. The criteria once again for a Break Level is it must be two consecutive candles. Below you'll notice a Break Level.
- A Break Level can be tested multiple times. This will be referred to in future lessons as an "Origin Level."
A Break Level is formed by the wicks of two or more consecutive same-color candles at the top or bottom of a move. Red candles at the top of a sequence create a Break Level on the top side. Green candles at the bottom create a Break Level on the bottom side. When a Break Level is hit, price is attempting to break in the opposite direction.
The naming is intentional and precise. Hold Levels hold price. Break Levels break price. Break levels are the candle runs that signal a directional shift. Where a Hold Level says "this move will continue," a Break Level says "this move will be challenged." The relationship between hold and Break Levels is the fundamental polarity of every chart on every timeframe.
The color logic inverts at the Break Level. On the bottom side of a chart, red candles hold price up and green candles break price down. On the top side of a chart, green candles hold price down and red candles break price up. Everything in this science operates in opposites. The same color candle that creates a Hold Level on one side of the chart creates a Break Level on the other side.
The criteria for a valid Break Level is a minimum of two consecutive candles of the same color at the wick of a move. The Break Level is marked at the first candle in the sequence — not the most extreme. If five consecutive red candles appear at the top of a move, the Break Level is at the wick of the first red candle in that run, not the deepest one. The first candle marks the starting point of the directional challenge.
Because this science is entirely cyclical and mathematical, every data point on the chart affects everything that follows. If a Break Level is hit, it reduces the possibility of the chart continuing its current move without first processing that test. If a Break Level is never hit, the move cannot reverse — technically speaking, the chart cannot move in the break direction without first reaching and testing the Break Level. That is not a prediction. It is a structural consequence of the way the science works.
Break Levels function in tandem with Hold Levels at all times. At any given point on a chart, you have Hold Levels protecting Break Levels. If the Hold Levels continue to hold and the Break Level on the opposite side is never tested, the original direction is intact. The moment a Break Level is tested — exactly, not approximately — the chart is signaling a directional attempt in that break direction.
When a Break Level on the top side is tested, price is attempting to break upward. When a Break Level on the bottom side is tested, price is attempting to break downward. Testing a Break Level is not confirmation that the break will succeed — it is the opening of the possibility. Other factors, which later lessons cover, determine whether the Break Level will be successfully cleared or whether the chart will reverse back into its original direction.
Charts that are moving upward have a clear signature: Break Levels on the top side are being continuously tested and the Break Levels on the bottom are never reached. Each successive test of a top-side Break Level is followed by price pulling back and then pushing higher. This Laddering pattern — test a break, pull back, test a higher break — is the structural expression of an uptrending chart. Remove all the noise and you are left with this: Break Levels defining where price is going next.
Close does not count. If price approaches a Break Level but does not reach the exact price of the level, it has not been tested. The same binary rule that applies to Hold Levels applies identically to Break Levels. A level exists or it does not. It has been tested or it has not. The downstream logic of the science depends entirely on which levels have been hit and which have not.
Break levels are the first form of information that tells you a chart might be polarizing — turning a zone of the chart into a directional boundary. A Break Level tested once is just that: a tested Break Level. When a Break Level receives multiple separate, independent tests with candle separation between them, it transitions into something with more structural significance. That transition is covered in the next lesson.
03 - Origin levels
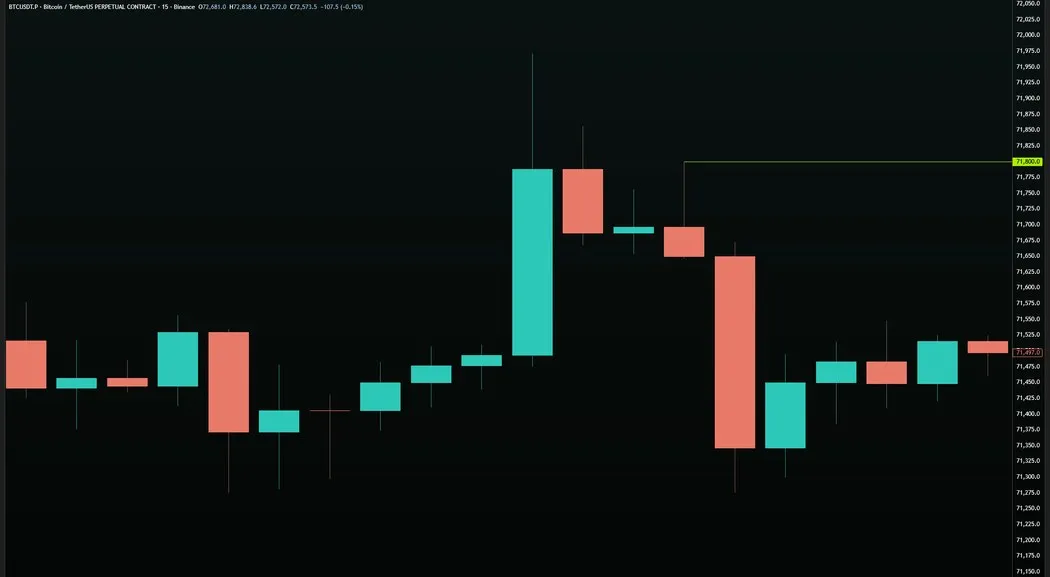
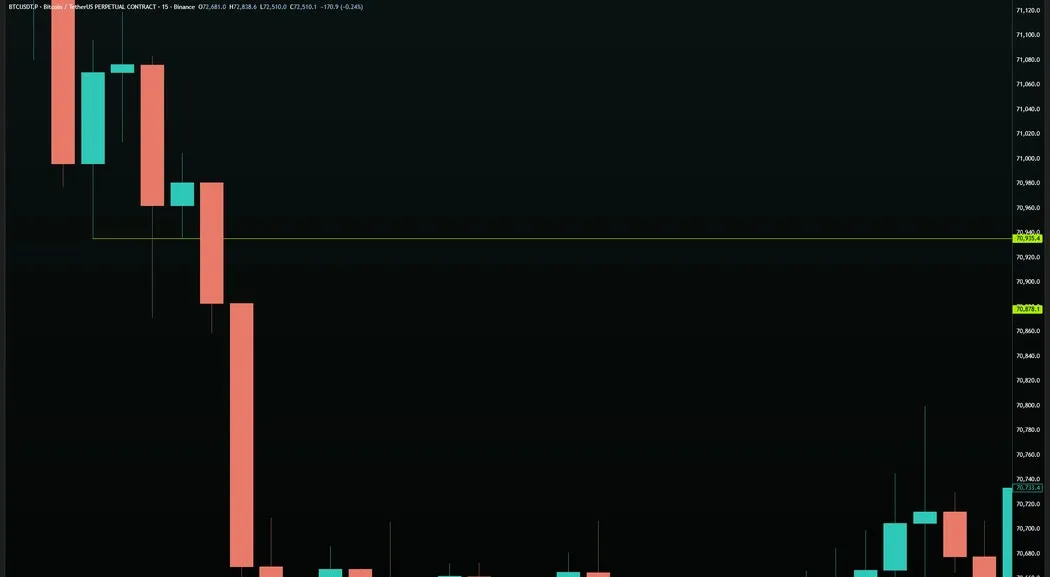
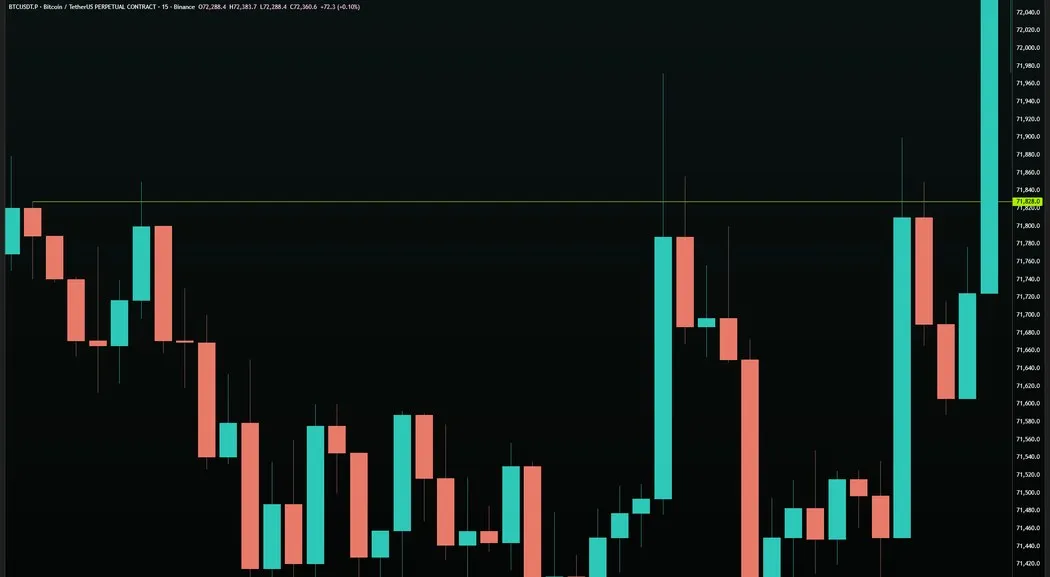
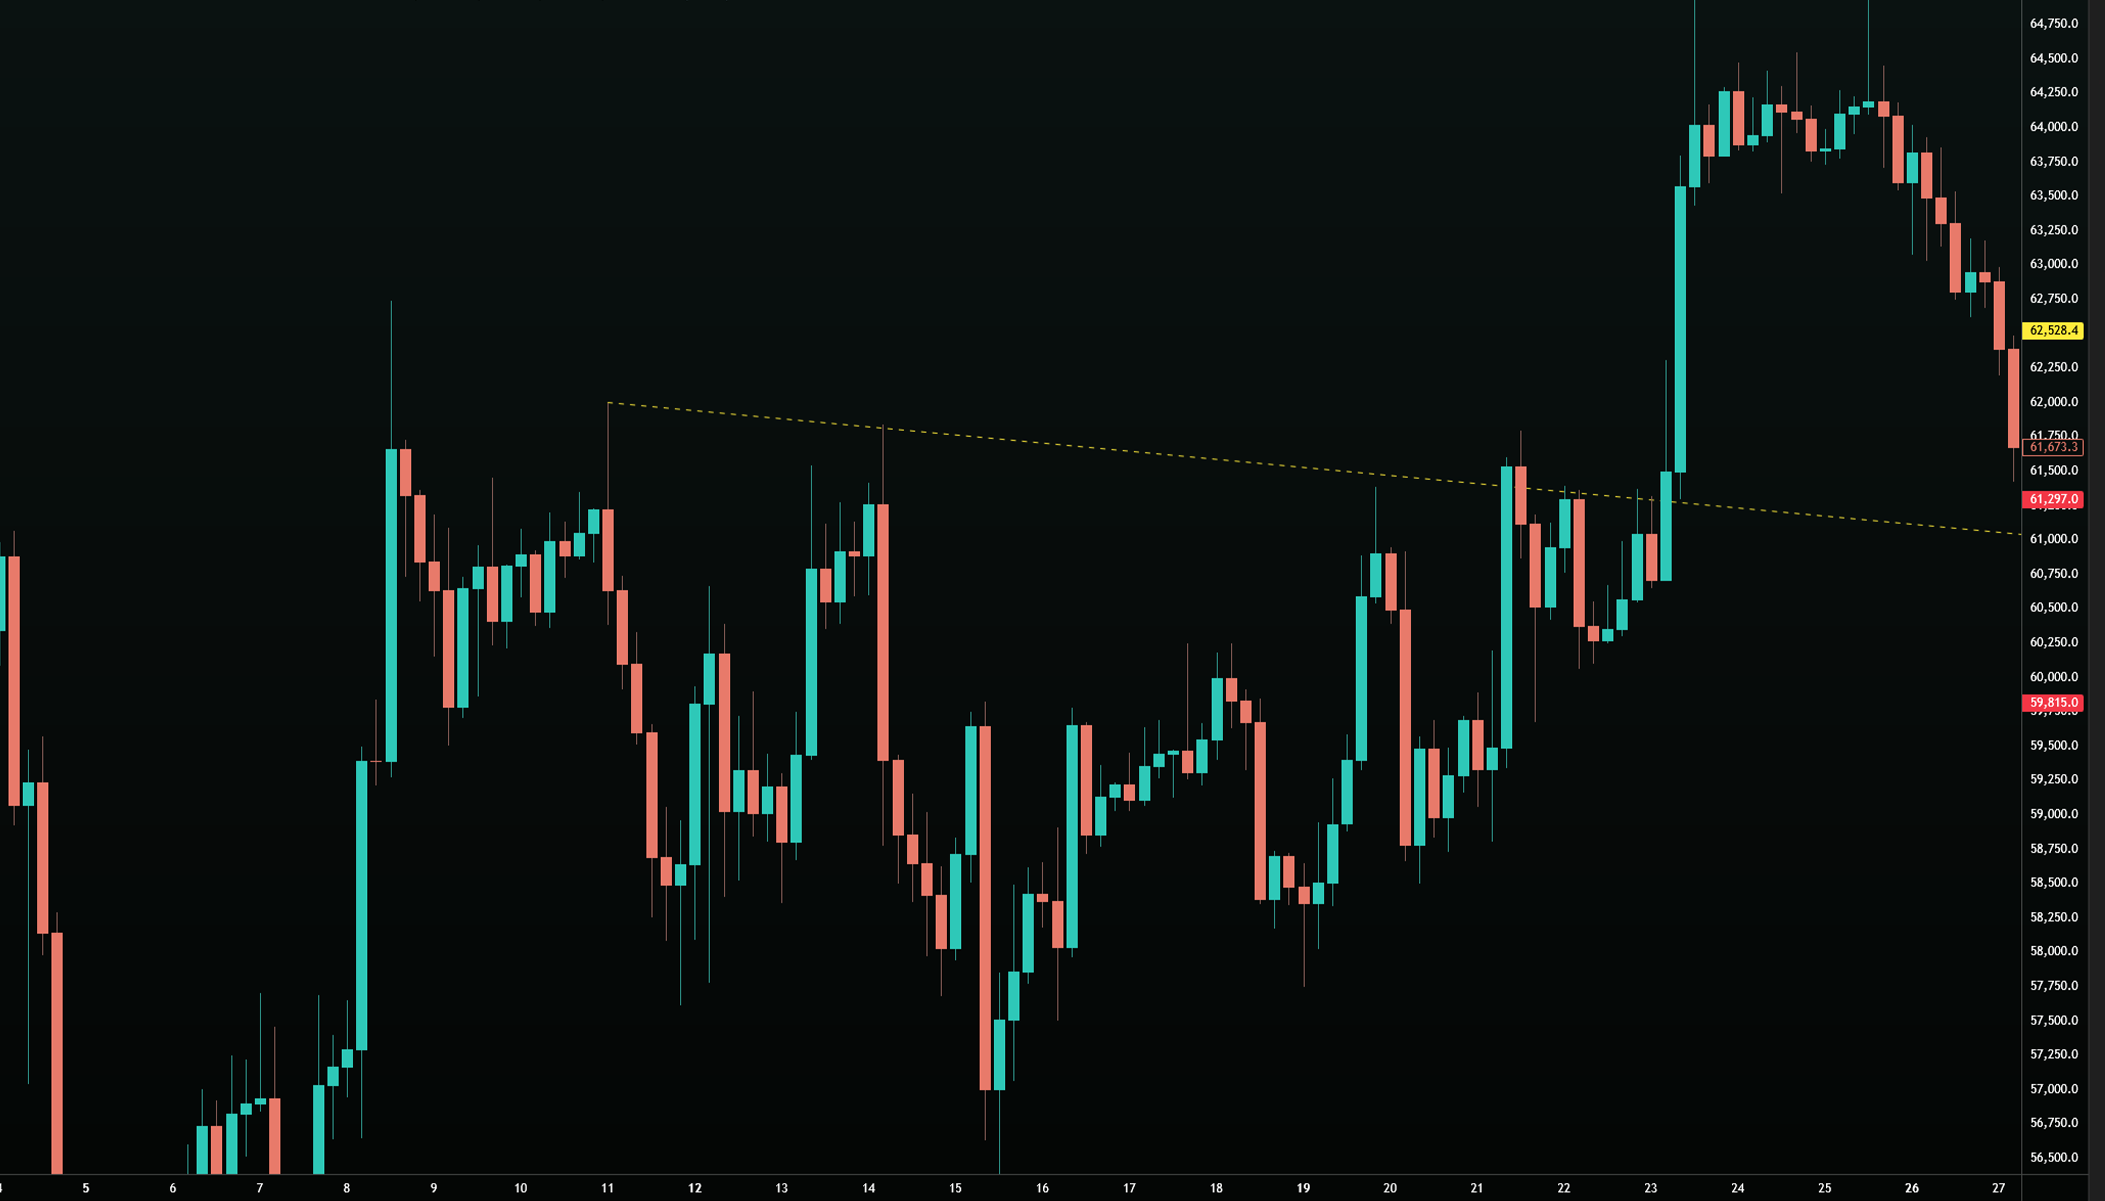
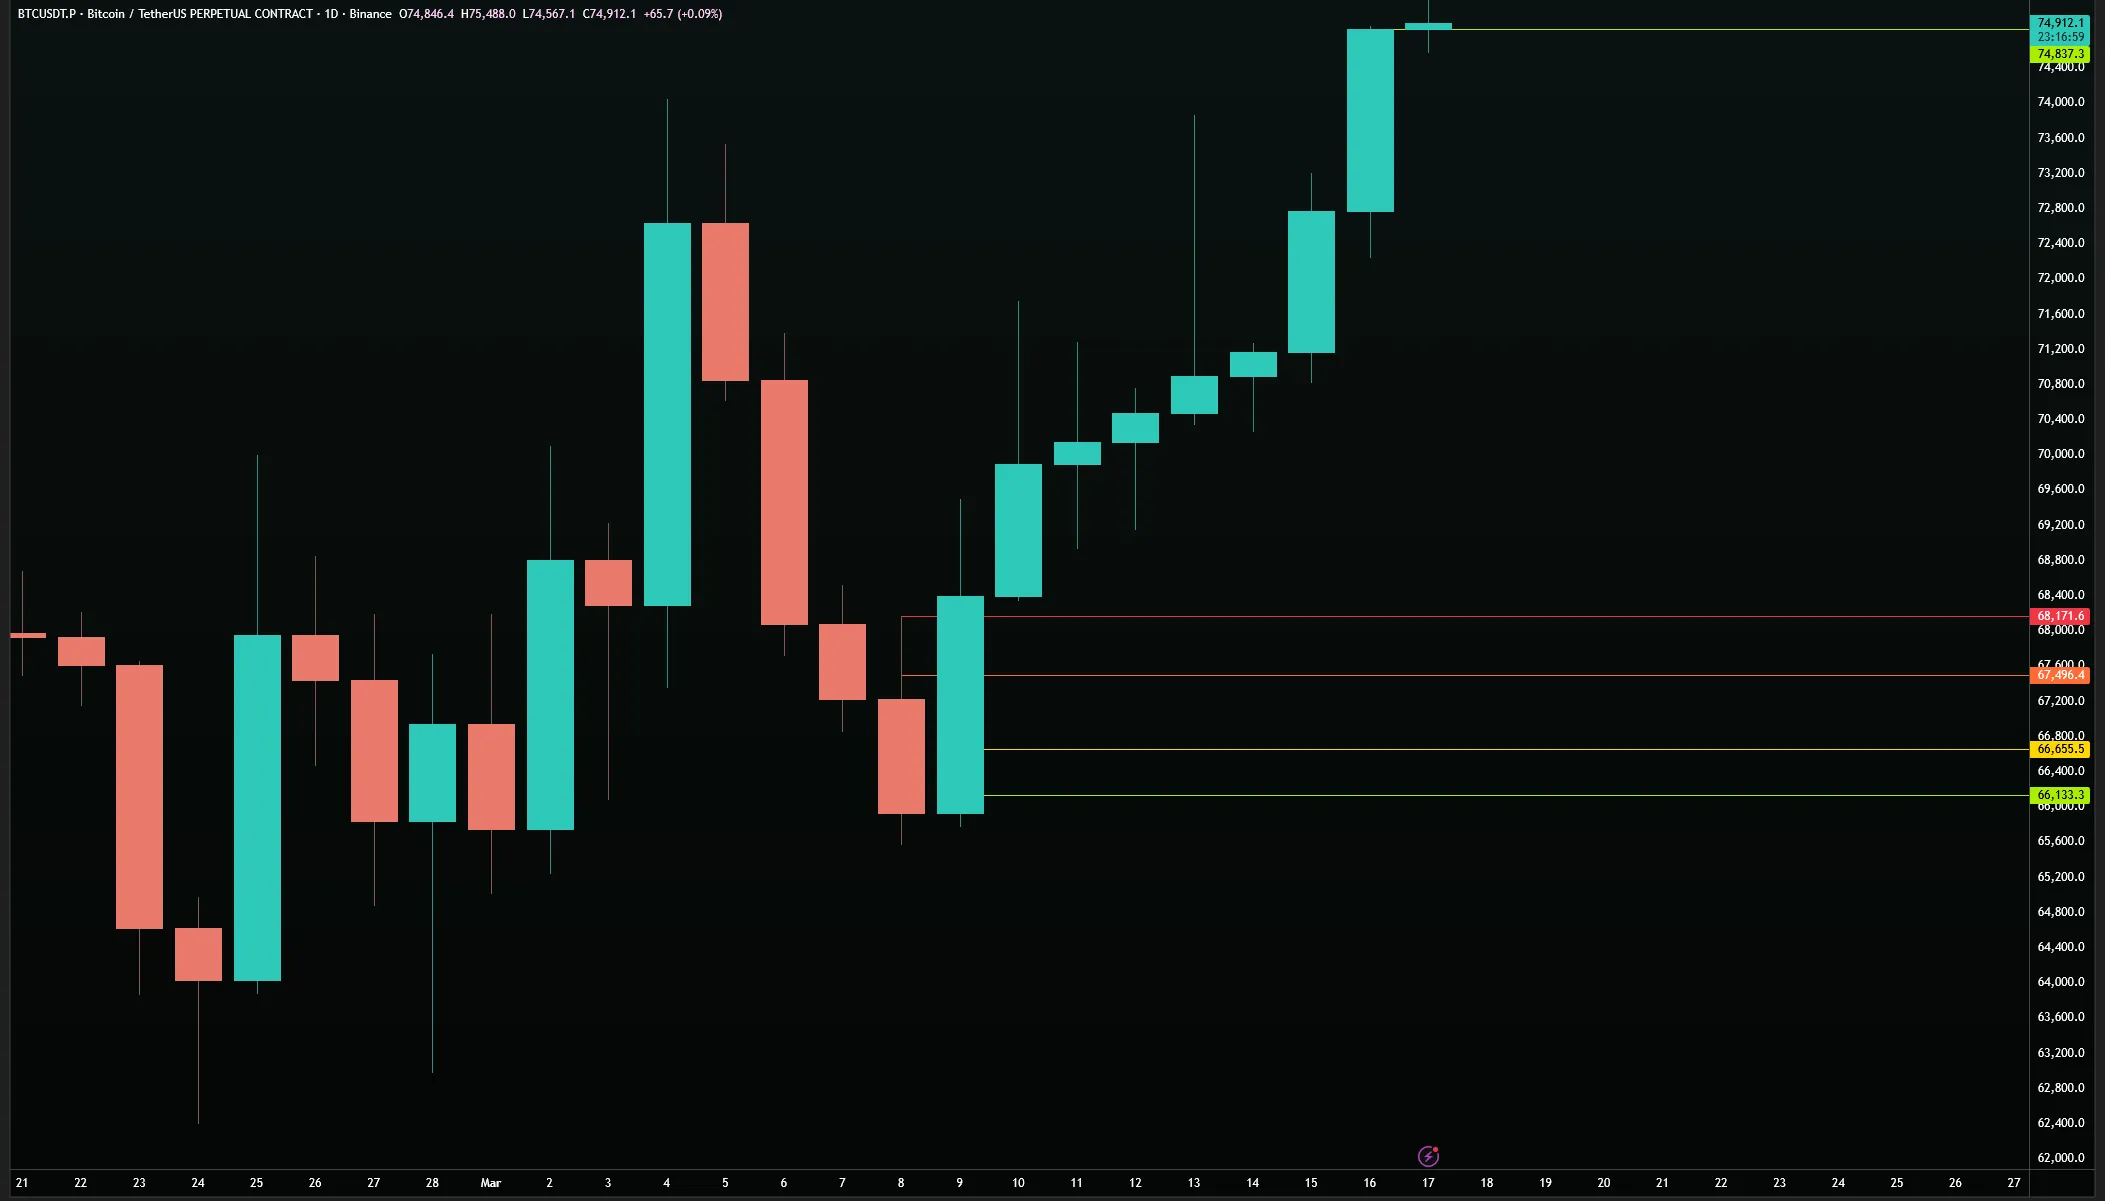
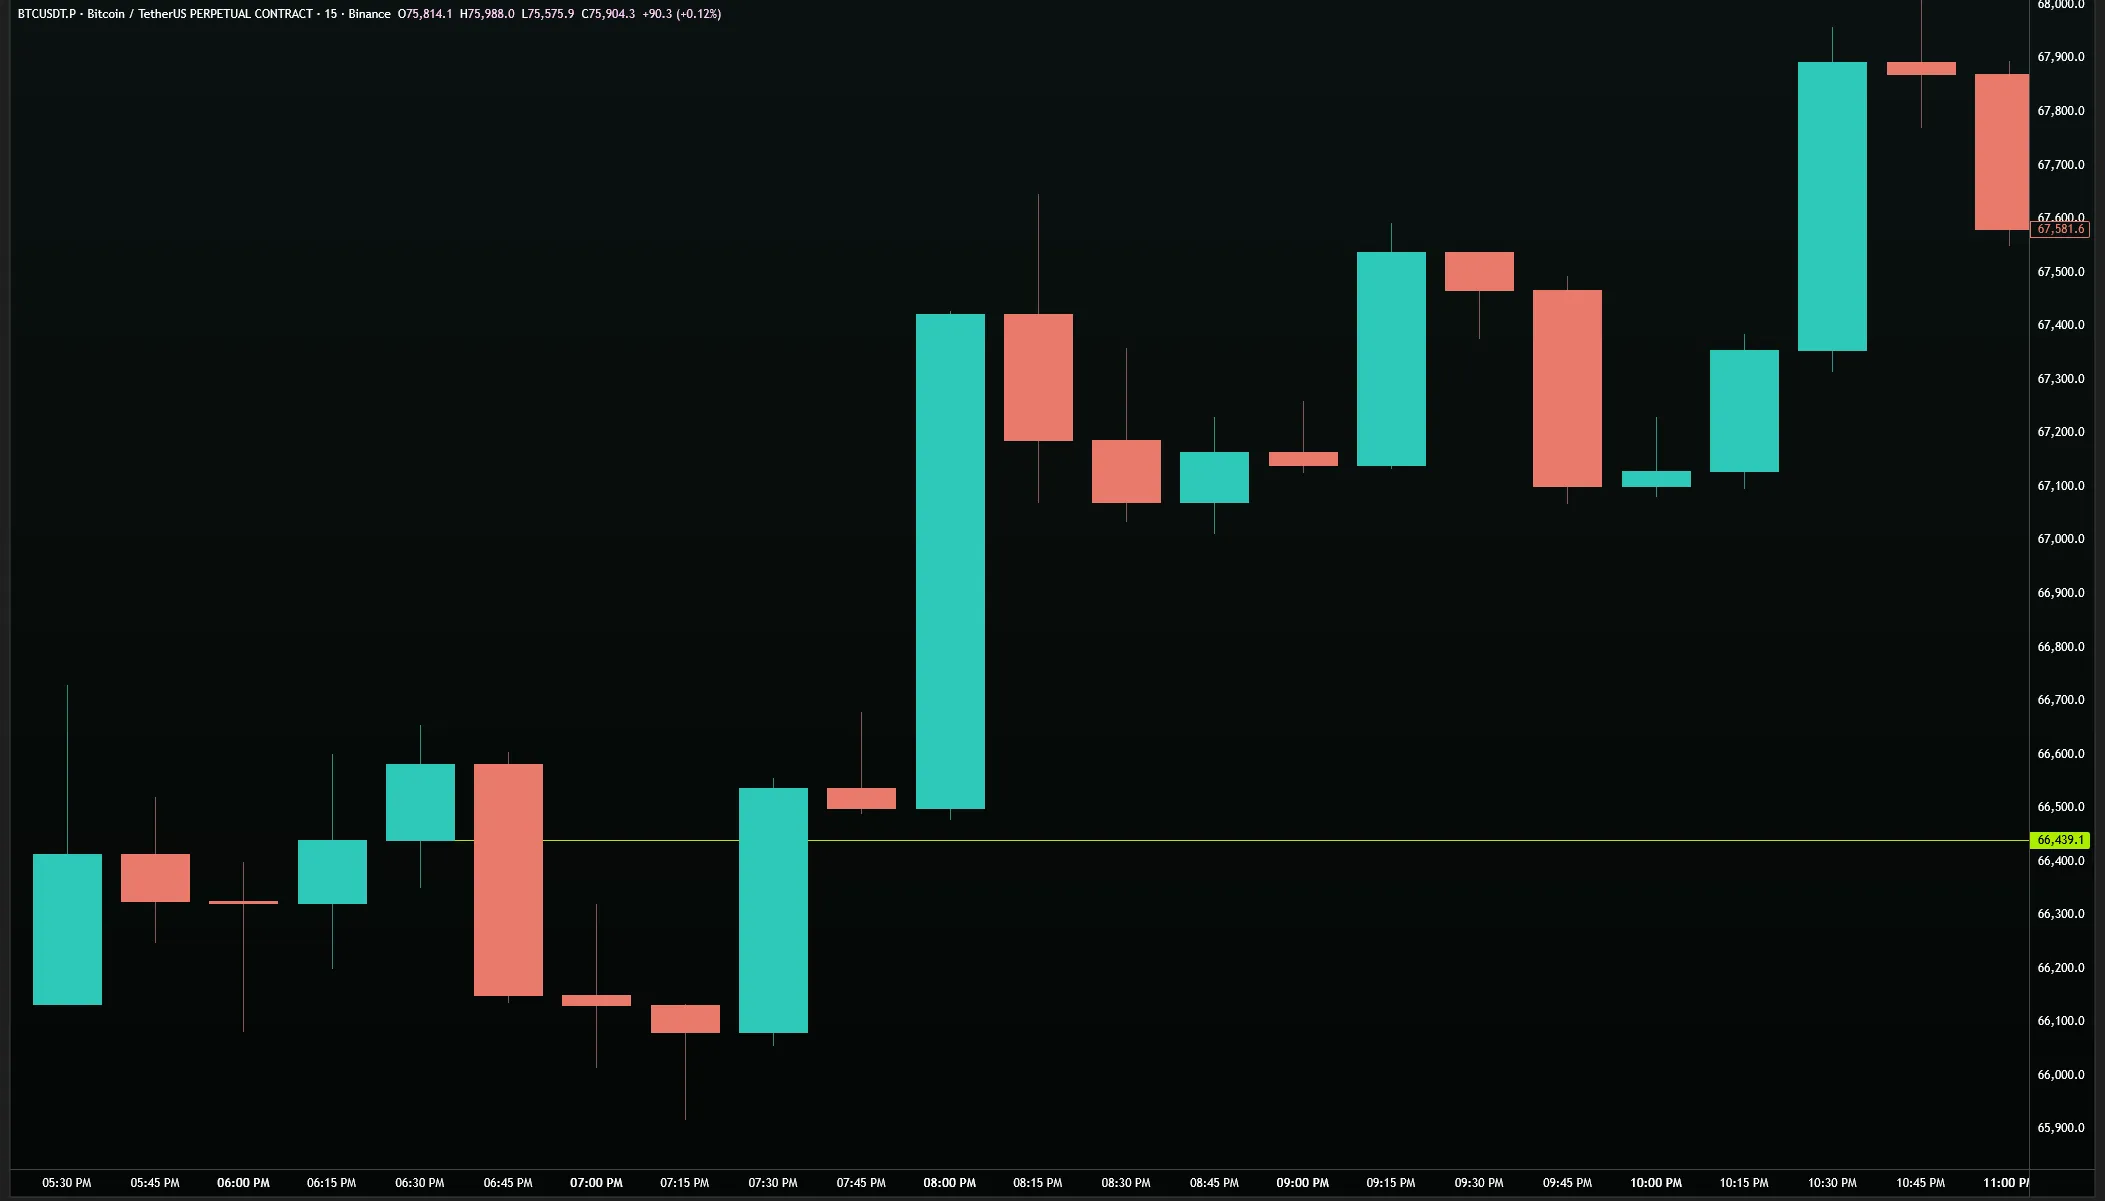
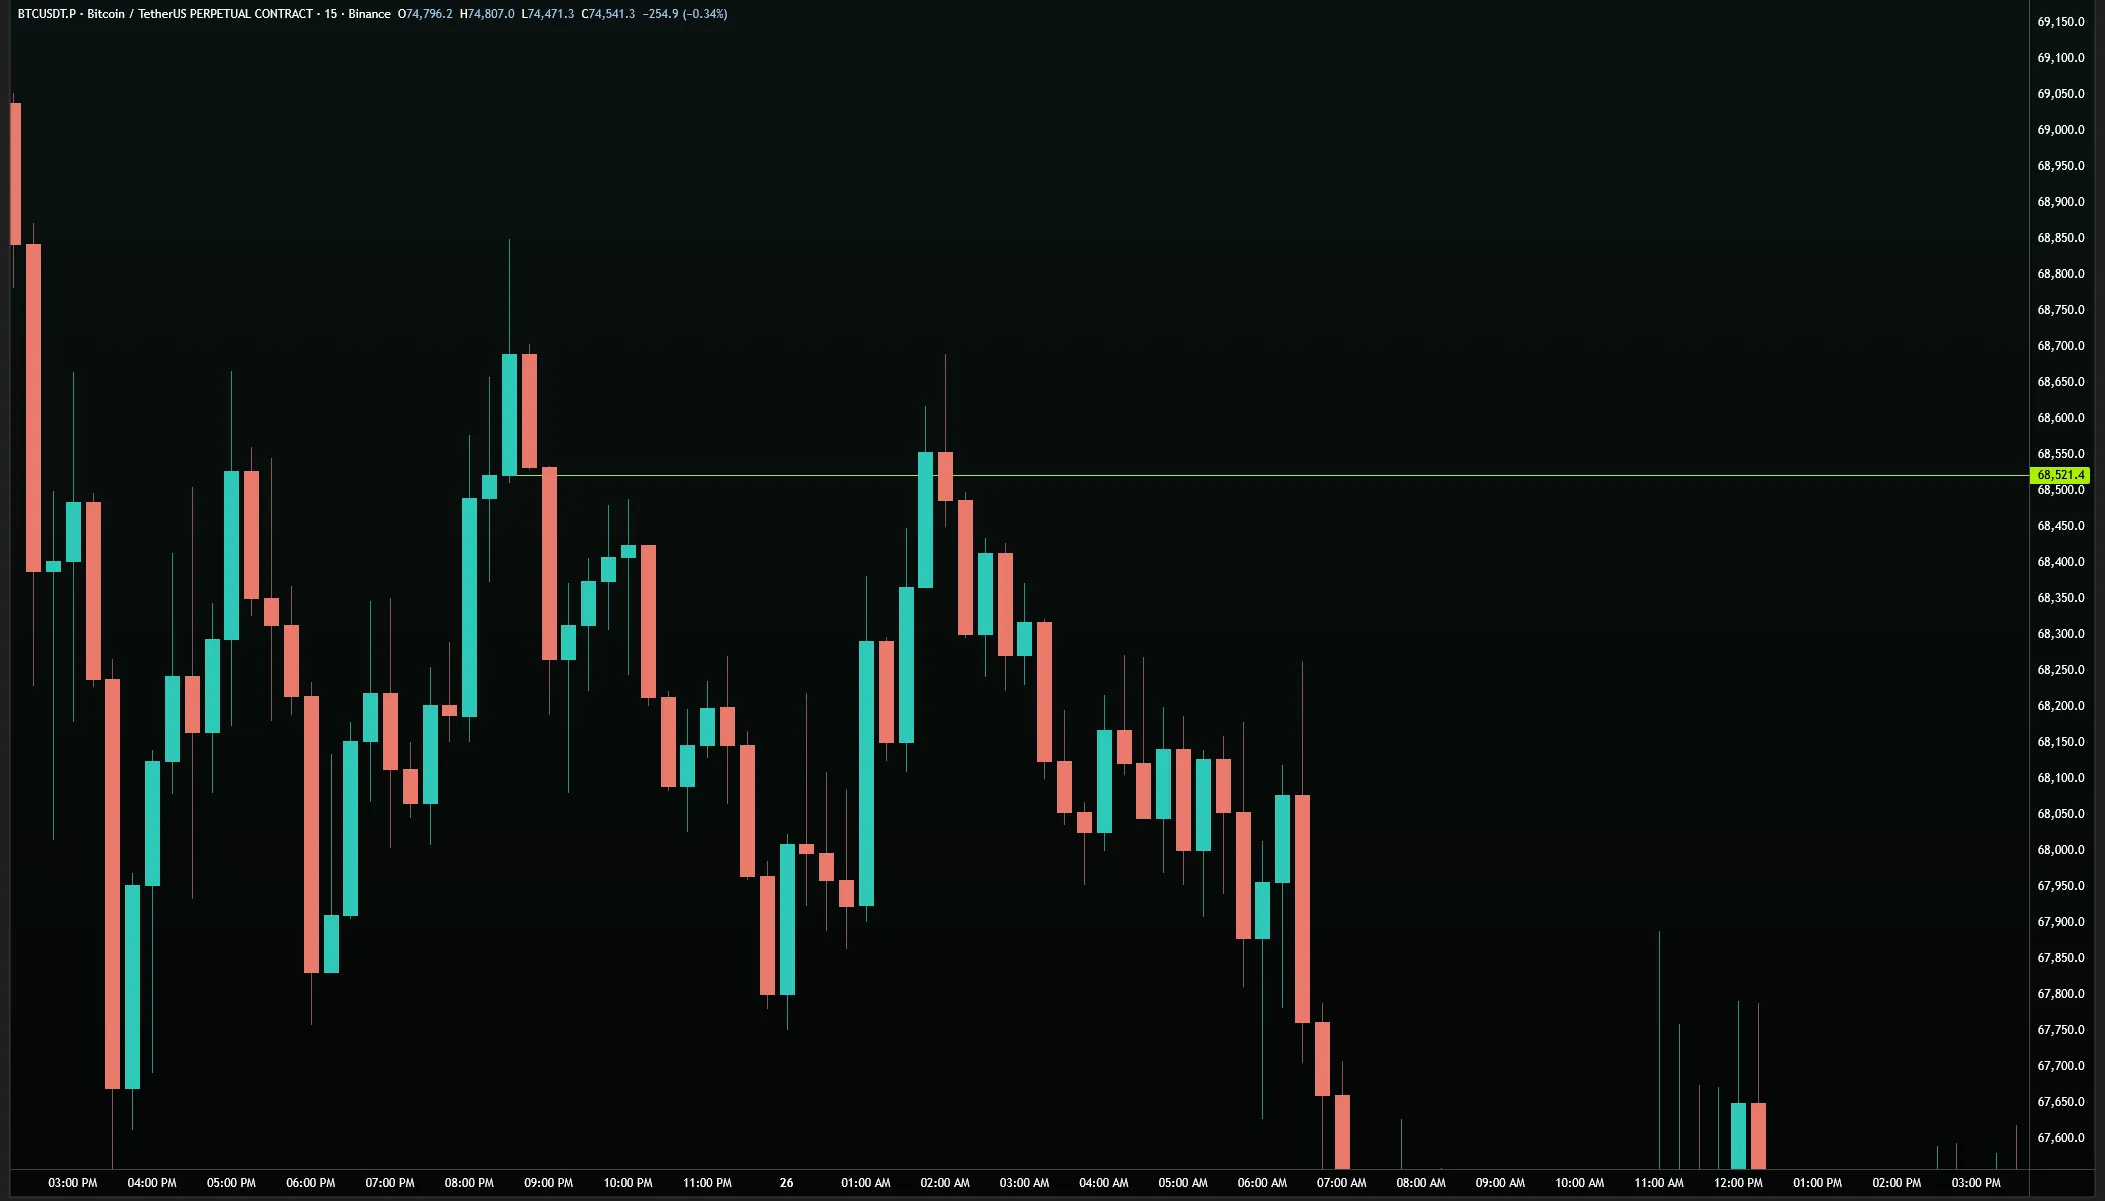
Origin Levels are known as Origins, and are defined by a Break Level that was hit multiple times but never broken. Origins create Polarity on our charts.
An Origin Level means that in the future I can say, hey, this is a Break Level. It is not Polarity, while this one is Polarity — it's an Origin Level. As with all Polarity, if it continues to stay above polarity, it's going to break up. If this continues to stay below polarity, it's going to break down. Let's go somewhere else on the charts to find it. Here is a Break Level that got hit multiple times. It is now able to be called an Origin Level. It has never hard closed.
- It is a Break Level if it gets hit one time. The next time this level hits would make it an Origin Level because it is being hit two times. Remember: our rule is a candle must be hit two times and there must be a candle of separation where the Break Level is not tested between hits.
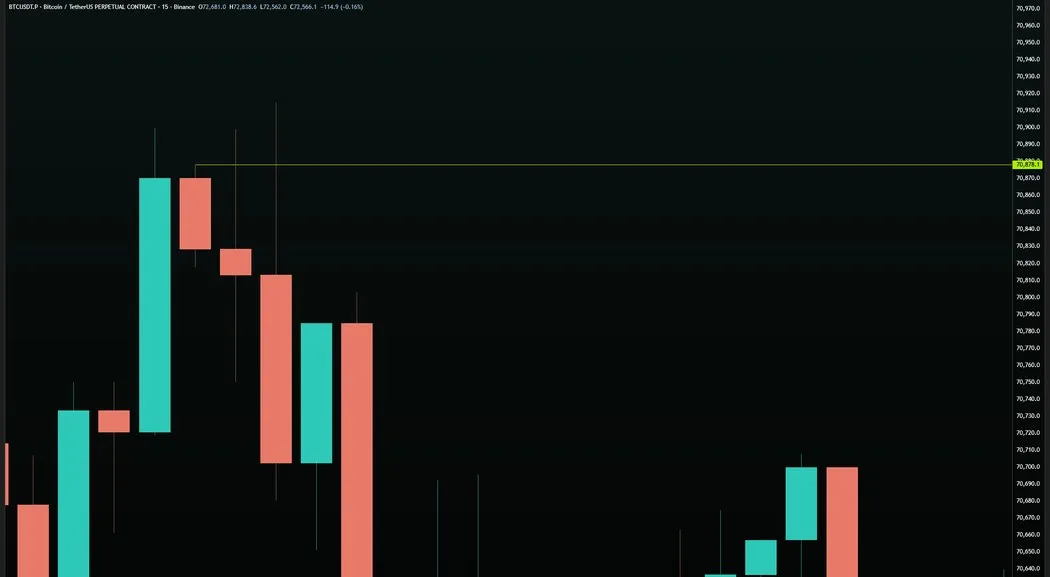
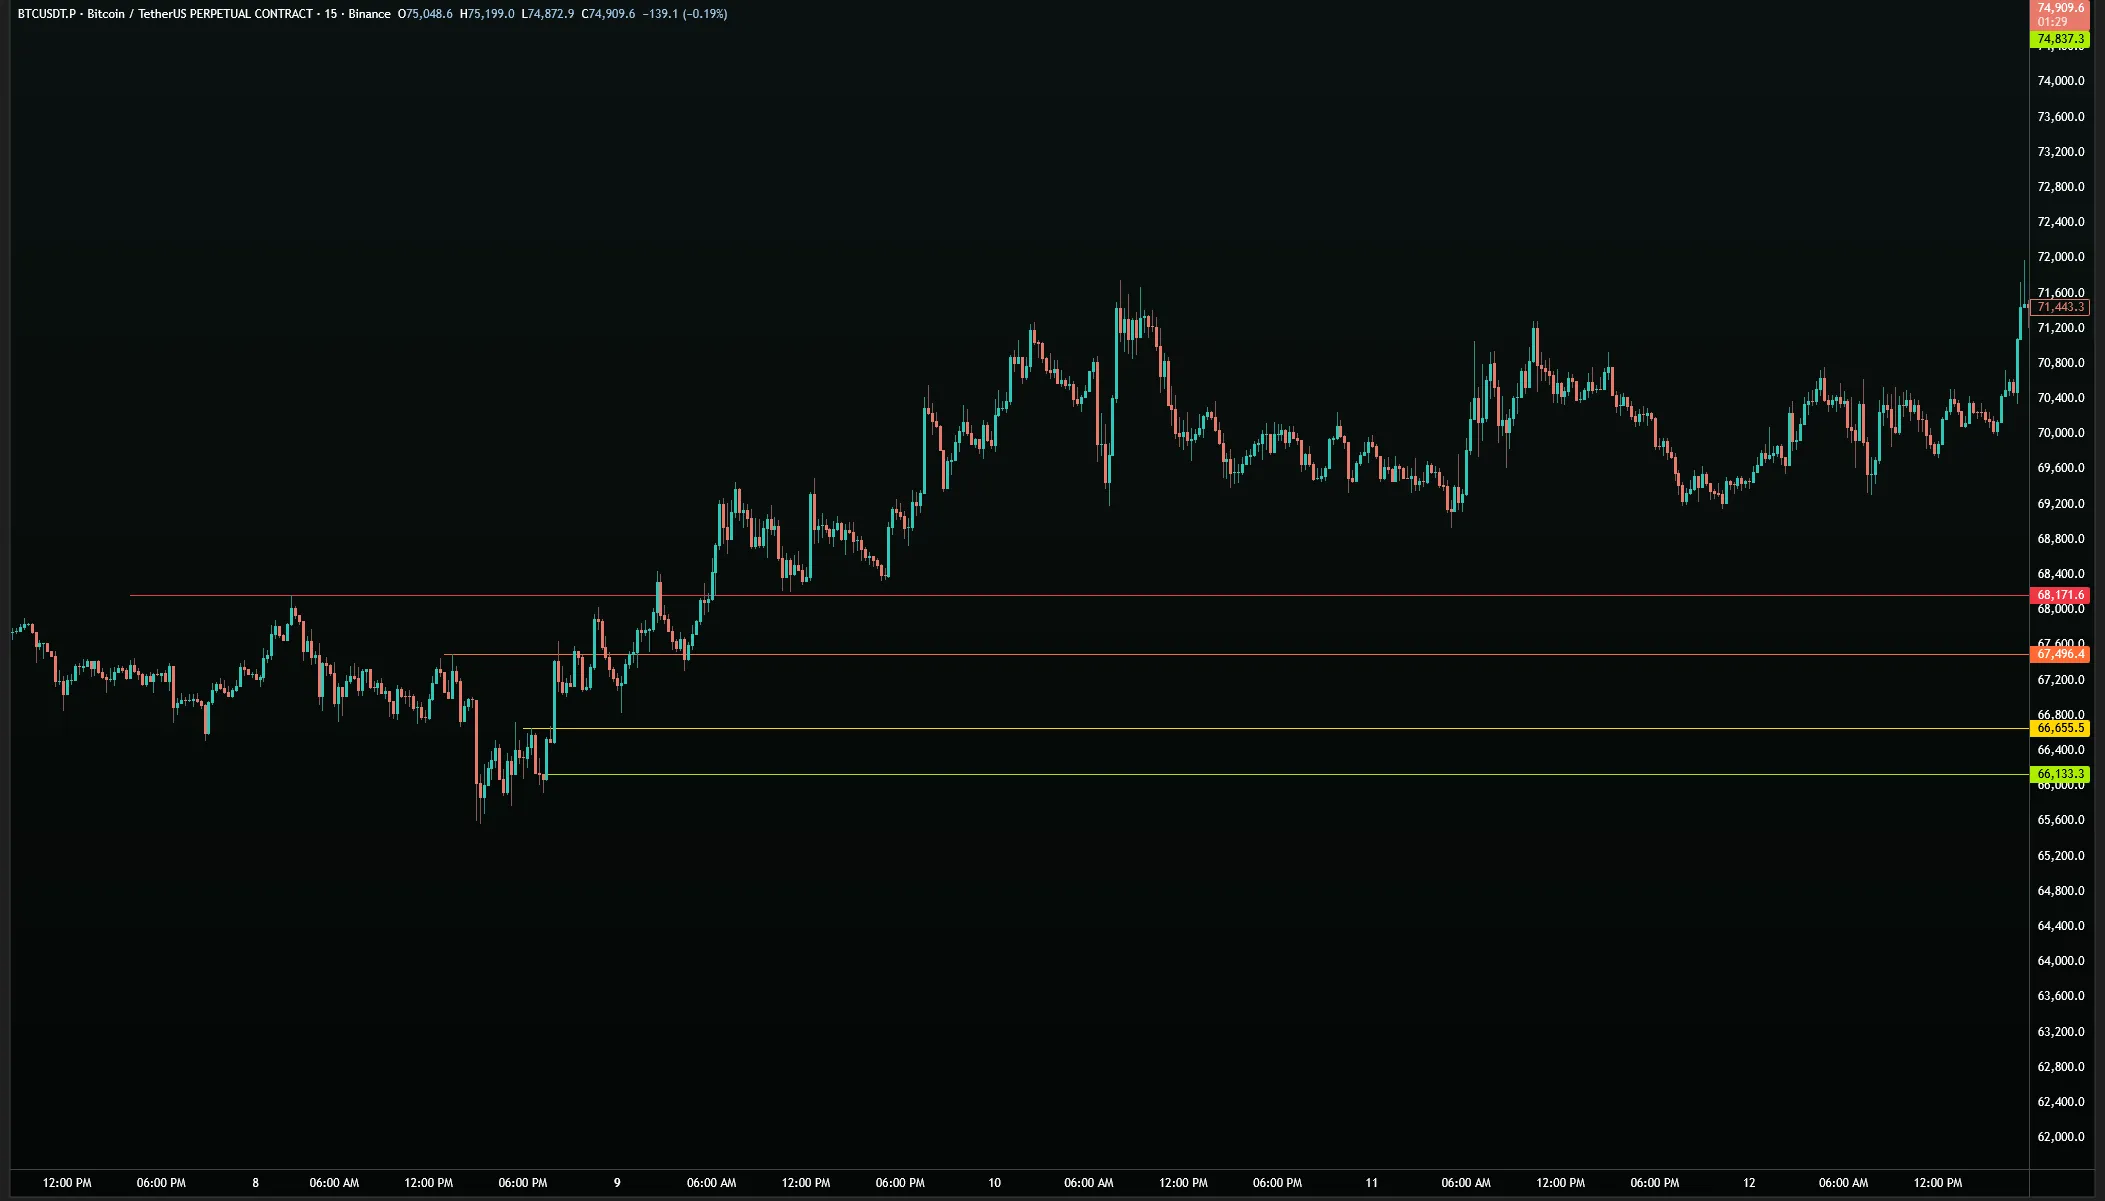
An Origin Level is a Break Level that has been independently tested at least two times, with at least one candle of separation between each test. Once a Break Level qualifies as an origin level, it becomes the first form of Polarity on the chart.
The distinction between a Break Level and an origin level is not just semantic — it changes what the level means for future price behavior. A Break Level tested once is simply telling you that price attempted to move in a specific direction. A Break Level tested twice with proper separation is telling you that the chart has now divided into two distinct zones. That boundary — the origin level — is polarity. Being on one side of it versus the other carries entirely different implications for where price will go next.
Polarity divides a chart into two separate areas. When price is above an origin level, the chart is structurally positioned to continue attacking higher. When price falls below that origin level, it has entered a different structural zone — and the chart is positioned to continue moving lower toward its next target. This is not directional bias. It is the recognition that the chart has created a structural boundary, and that boundary has weight.
The exact criteria for an origin level: First, it must be a Break Level — two or more consecutive same-color candles at the extreme of a move. Second, it must be independently tested at least twice, meaning at least one candle must appear between the two tests that does not touch the level. Consecutive hits with no candle separation do not qualify. The second test must be a separate, distinct event. Third, neither test can have resulted in a hard close — a concept covered in a later lesson.
The number of times an origin level is tested beyond the minimum two does not increase its strength. Whether it is tested twice or ten times, it remains an origin level — a polarized point. The first test creates a Break Level. The second independent test converts it to an origin. Everything after that is confirmation of existing polarity, not escalation of it.
Visually, origin levels should be marked as dashed lines. This distinguishes them from Break Levels and Hold Levels at a glance. The dashed line communicates two things: first, that this level has been tested multiple times and is therefore polarity; second, that it is one timeframe higher than where it was originally created. An origin level on the 15-minute chart operates as a one-hour level. An origin on the one-hour chart operates as a four-hour level. Every time a Break Level becomes an origin, it climbs one rung up the timeframe ladder.
The practical implication of this is significant. When price is approaching an origin level from below, you are not dealing with a 15-minute level. You are dealing with a one-hour level. The structural weight of that test, and the potential move that follows it, should be understood in the context of the higher timeframe — not the one it was created on.
Polarity creates two-sided trades. Once an origin level exists, price on the correct side of it will be attempting to hold that position. Price that gets above polarity will back-test it and, if held, launch toward the next target. Price that gets pushed below polarity will use it as resistance from above and move toward lower targets. The origin level is the line that splits the chart into two zones of expectation.
When you are looking at a chart and you cannot determine which direction price is moving, the first question to ask is: are there origin levels nearby? If price is between two origin levels — one above and one below — you are in what will later be described as a Pandora's Box: a state of structural ambiguity where neither side has definitively won. Understanding which origin level gets tested first, and whether that test holds or breaks, is what resolves the ambiguity.
The transition from Break Level to origin level is a marking decision you make in real time. The instant a Break Level receives its second independent hit with proper candle separation, convert the line to dashed. Add the color code for the appropriate timeframe it has escalated to. From that point forward, treat it as a polarized level — one that divides the chart structurally — not merely as a level that has been tested.
Extra question: The Break Level in this image is intentionally marked wrong — that should have been obvious to you upon first glance if you understand Break Levels. Can you identify where the correct Break Level should be marked?
04 - Trends
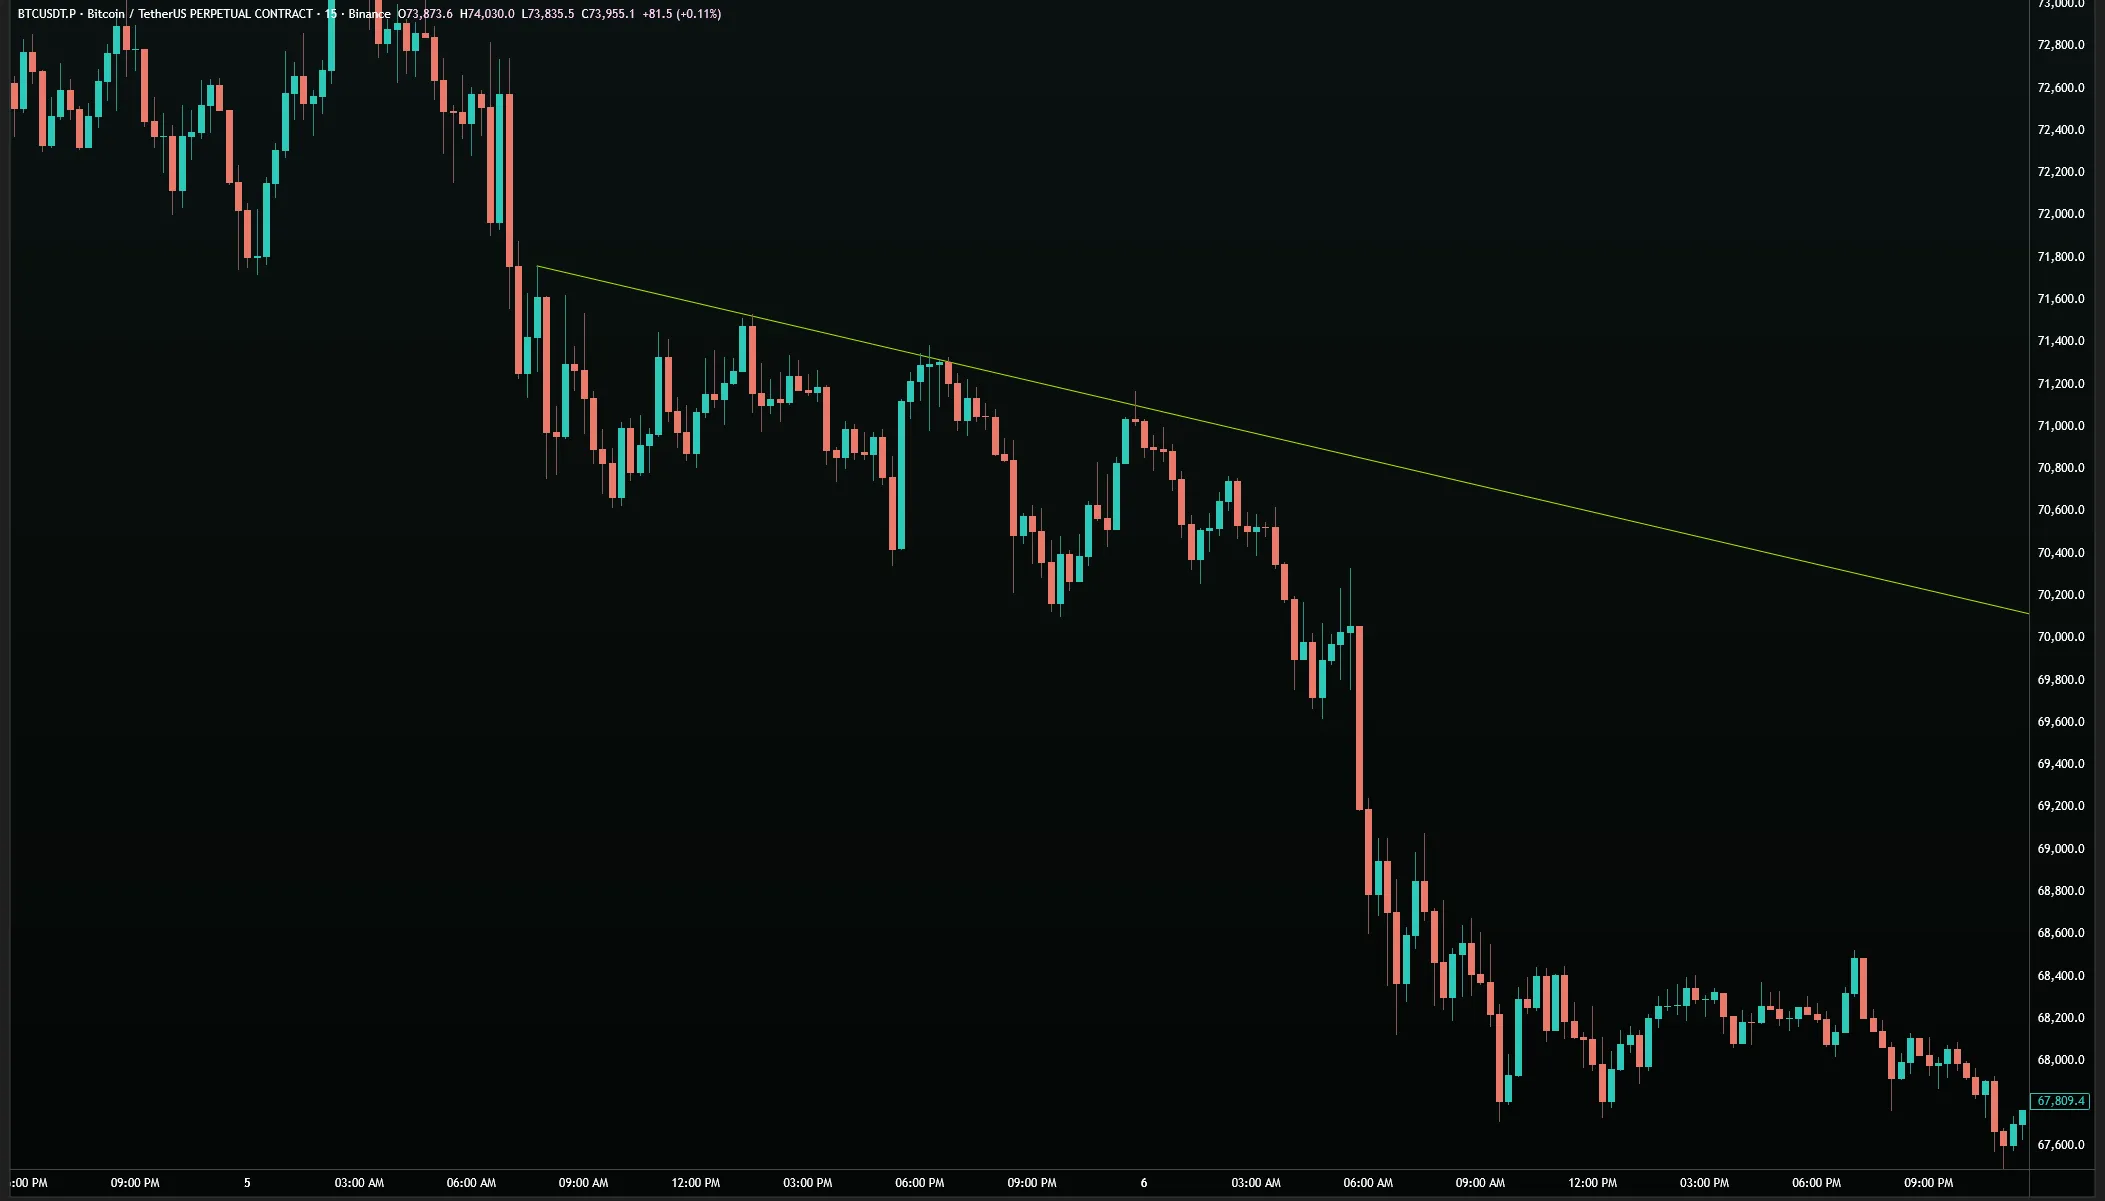
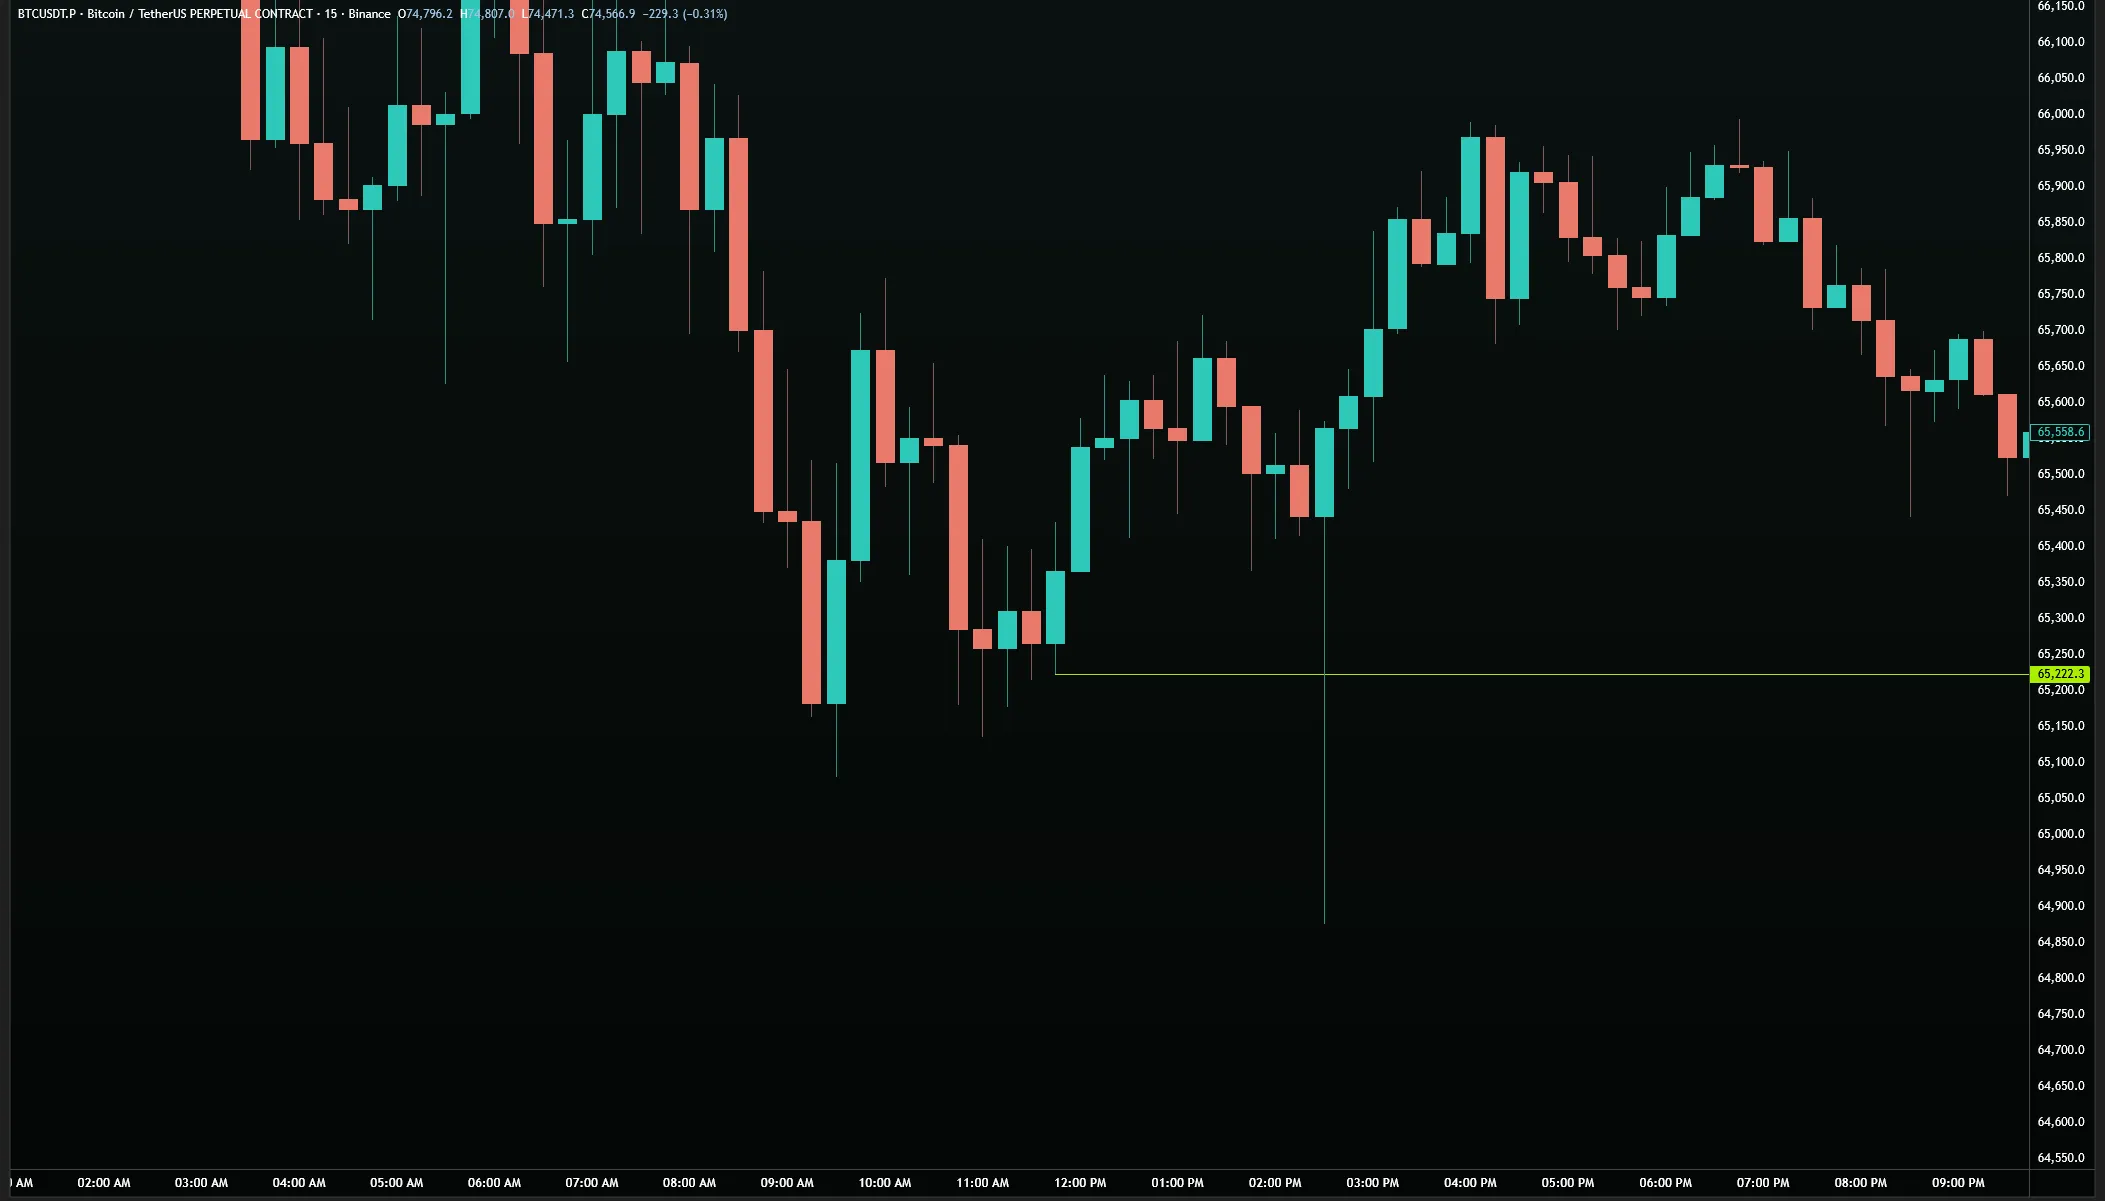
Trends are diagonal levels on our charts that use the wicks to define a level with a time constraint.
- Mark both your base point and reach point on your Trends as green candle wicks on the bottom side of your chart, and red candle wicks on the top side of your charts. Remember: Everything is in opposition in Day Trading.
A Trend is a diagonal level on the chart. Trends are not a separate category of technical tool — they are levels that exist at an angle. Everything that applies to horizontal levels applies equally to trends. When a trend is tested, it is tested. When it is broken, it functions exactly like any broken level of its timeframe.
The common misconception about trends is that their value increases with age — that a trend line which has existed for months or years carries more weight than a recent one. This is incorrect. The value of a trend is determined by the timeframe it exists on, not by how long it has been in place. A four-hour trend is a four-hour level, regardless of whether it was created last week or last year. When you lose a four-hour trend, you go to the next four-hour level — not to some undefined "major breakdown."
Another common misconception is that breaking a trend line signals a massive directional move. A trend break does not automatically produce a large move. When a trend is broken, price goes to the next appropriate level on the same timeframe. If there are four-hour levels below a four-hour trend, price goes to those levels sequentially — not to some distant target simply because a diagonal line was crossed.
A Trend must have a non-zero angle. A completely horizontal line is a level, not a trend. The distinction matters because as time progresses, even a tiny angle — even one with a 0.01-degree angle — creates significant distance between the trend and price. Over a large timeframe, a near-horizontal trend can represent hundreds of points of separation even though it was initially indistinguishable from a level. Always verify that a line you are calling a trend actually has an angle.
As time passes, trends lose relevance — not in the sense of "strength," but in terms of distance to the next level. If a trend was broken early in its existence when other horizontal levels were nearby, the resulting move would go to those horizontal levels. If the same trend is broken much later, those intermediate horizontal levels may have already been tested, and the next untested level could be much farther away. The distance to the next target changes with time. The trend itself does not change in nature — the chart around it does.
Trends are created the same way horizontal levels are — by connecting points of the same color candles at the same structural position. A valid trend on the bottom side of a chart connects the extreme candle bodies or wicks of valleys. A valid trend on the top side connects the extreme candle bodies or wicks of peaks. The timeframe of the candles being connected determines the timeframe of the trend, exactly as it does with horizontal levels.
When a trend breaks, the correct question is not "how big will this move be" but "what is the next untested level of this timeframe?" That is the target. If price is currently at a four-hour trend and breaks it, find the next untested four-hour horizontal level. That is where price is going. The trend is just one of the levels on the chart — when it is lost, you move to the next one.
Trends are levels. Range trends are levels. Origin levels are levels. Rejection as target is a level. Every mark on the chart is a level — some horizontal, some diagonal, some at a higher timeframe than where they were created. All of them operate by the same fundamental rule: tested yes or no, holding yes or no, break up or hold down. The terminology changes, but the underlying mechanism is identical.
05 - Range trends
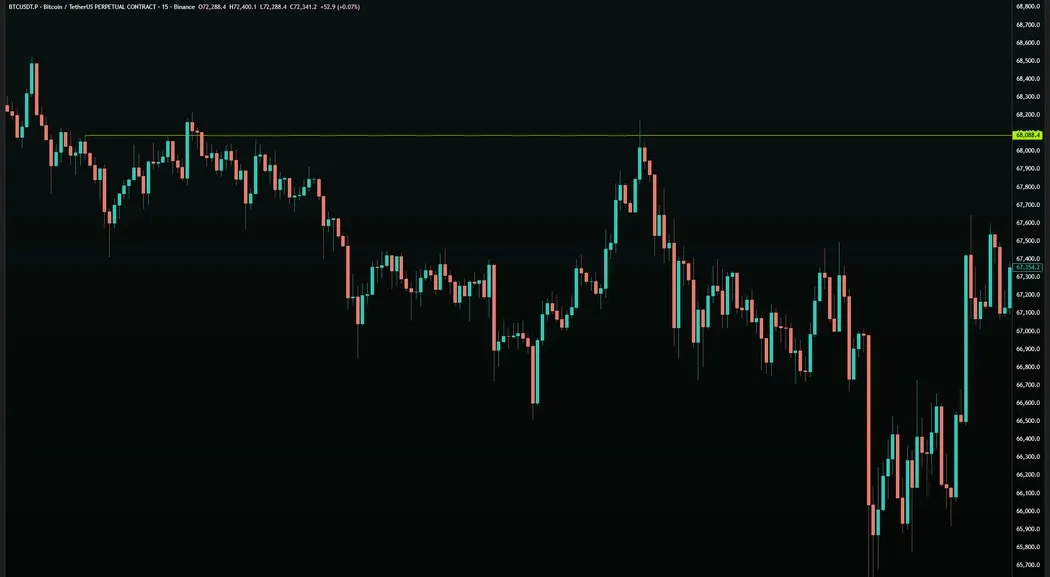
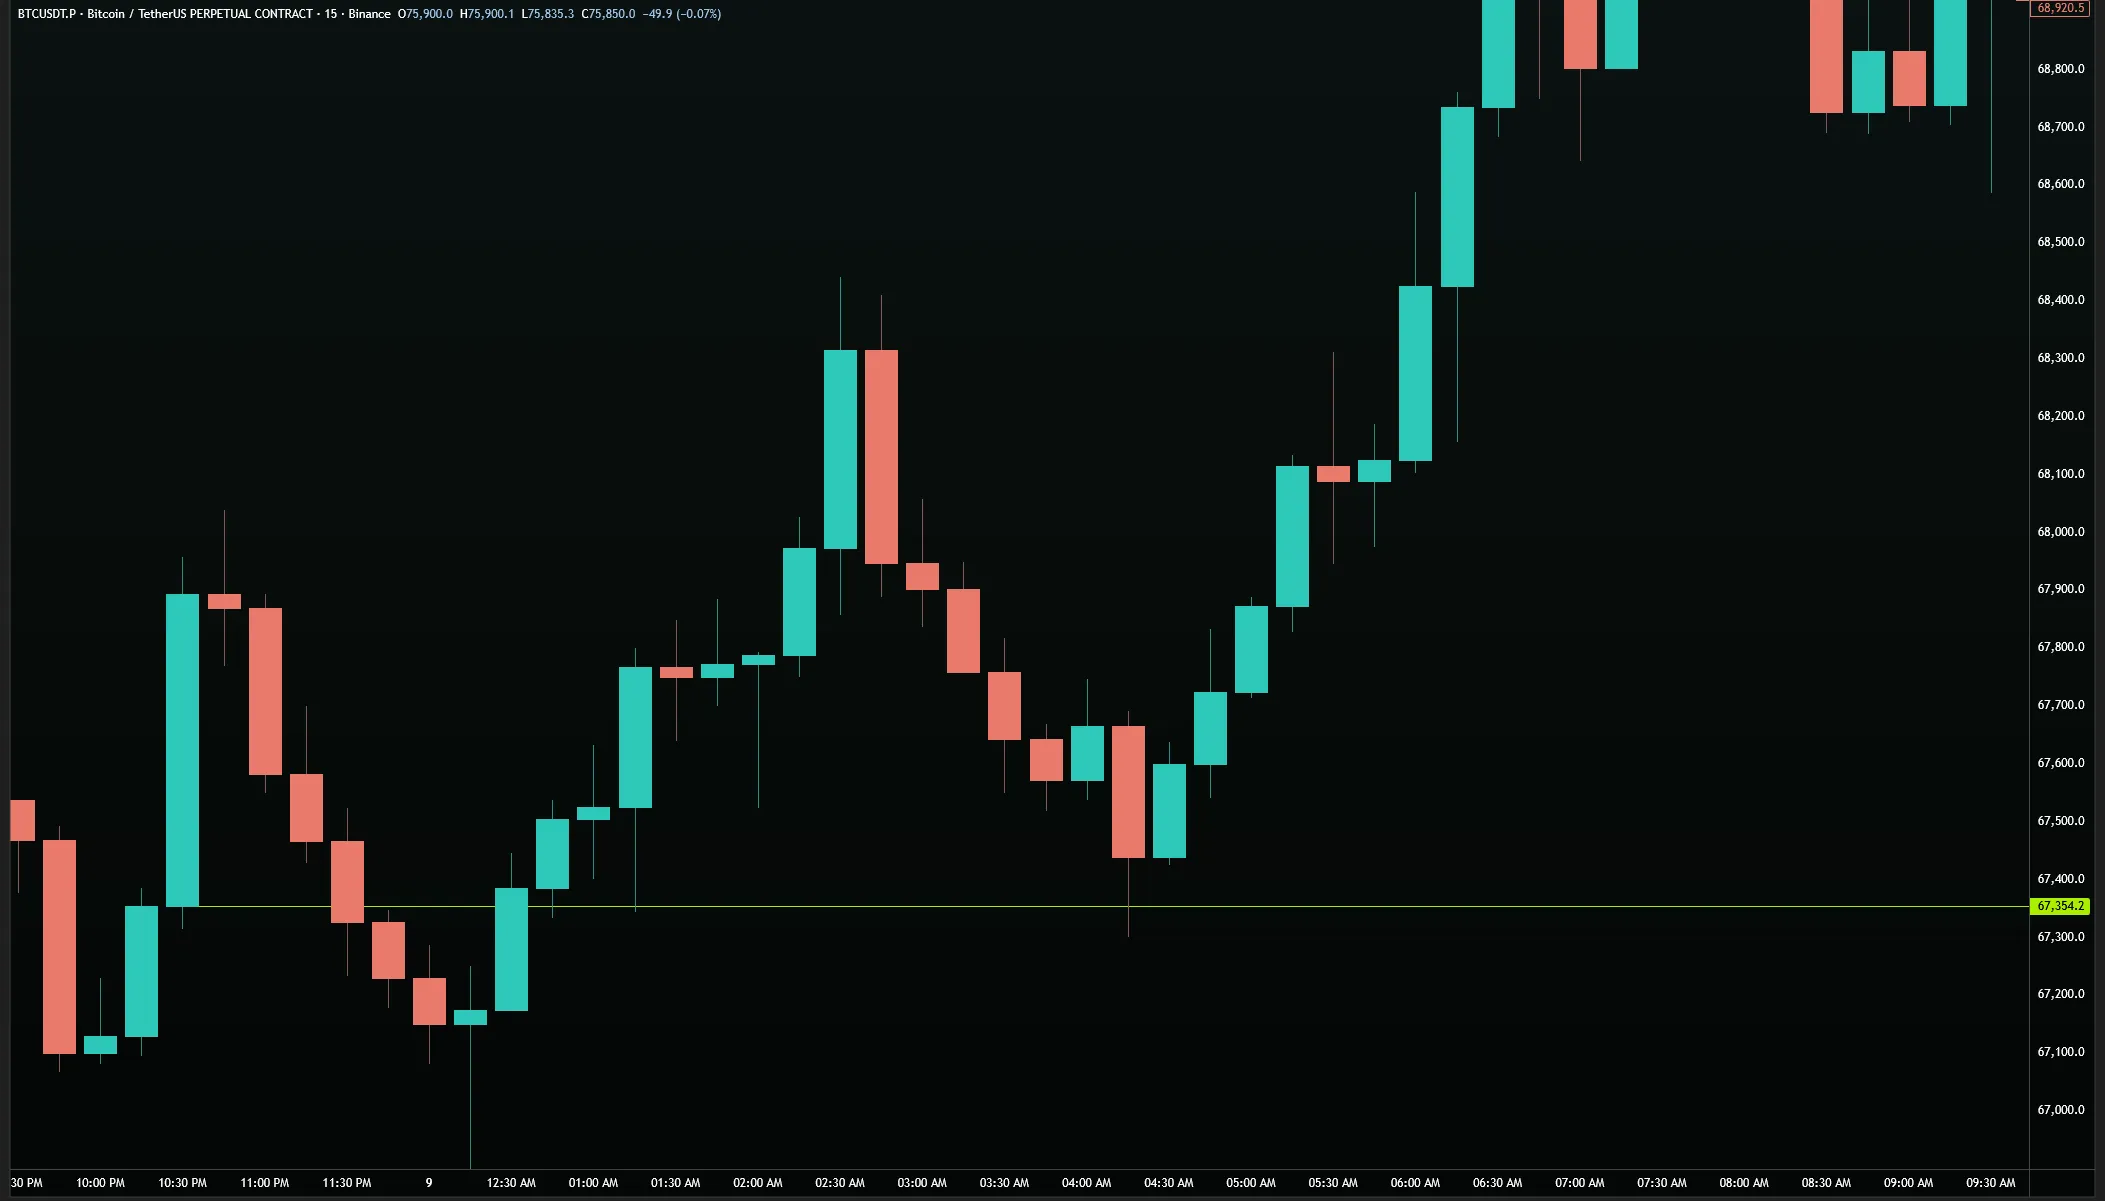
A Range Trend is a type of Trend that is attached where a Hold Level gets hit multiple times. It differentiates itself from a normal Trend as a type of trend that represents specific ranges.
- We're getting into a little bit more complex territory. Now that we've got our first couple basic concepts down, let's make things a little more complex. A Range Trend is when you have a Hold Level that is hit multiple times, and you mark a trend from and to Break Levels.
A Range Trend is a diagonal level formed at a Hold Level that has been tested multiple times and also meets the Break Level criteria at each test — meaning at least two consecutive same-color candles exist at the point of contact. A range trend represents the polarity of the entire range it sits within.
If you can't find Range Trends but do know that a Hold Level was tested multiple times, and have a suspicion that one should be there — in this case you should check all your other timeframes.
A range is the bounded area between the highest and lowest points of a move on a given timeframe. Ranges are defined by their tops and bottoms — the Break Levels and Hold Levels that mark the extremes. Inside any range, there will be sub-levels that help define where price is going within it. A range trend is the most important of these sub-levels because when it breaks, it typically signals that the entire range is under threat.
The difference between a regular trend and a range trend is specificity. A regular trend is simply a diagonal level connecting candle extremes. A range trend requires a Hold Level component — the candles touching the trend must meet both the Hold Level criteria (deepest red or highest green body) and the Break Level criteria (two or more consecutive candles). This dual structure makes a range trend a form of polarity rather than just a diagonal line.
When a range trend breaks, the entire bottom side of the range it was protecting typically collapses toward the next Hold Level below the range. The range trend does not predict where price will go next — it signals that the range structure is breaking. Where price lands after the range trend breaks depends on what untested levels exist below the range.
The minimum version of a range trend requires a Hold Level that has been hit at least twice with break-level candle structure at each hit. If a Hold Level has only been hit once, or if the candles at the hit point are single candles without consecutive same-color companions, it does not qualify as a range trend. The break-level structure at each touch is what gives the range trend its polarity property.
Range trends have an expiry built into their nature. As time passes and price continues to push against a range trend, the distance between the trend and the range boundaries changes. When a range trend finally breaks, it signals not just a level being lost but the range itself potentially shifting. Price does not simply go to the next level — it may exit the current range entirely and enter the next range down or up.
Understanding how ranges nest inside one another is important context for range trends. A range on the 15-minute chart exists inside a range on the one-hour chart, which exists inside a range on the four-hour chart. A range trend at the 15-minute level that breaks may resolve quickly within the one-hour range. A four-hour range trend breaking may represent the start of a move that resolves at the daily level. The timeframe of the range trend determines the significance of its break.
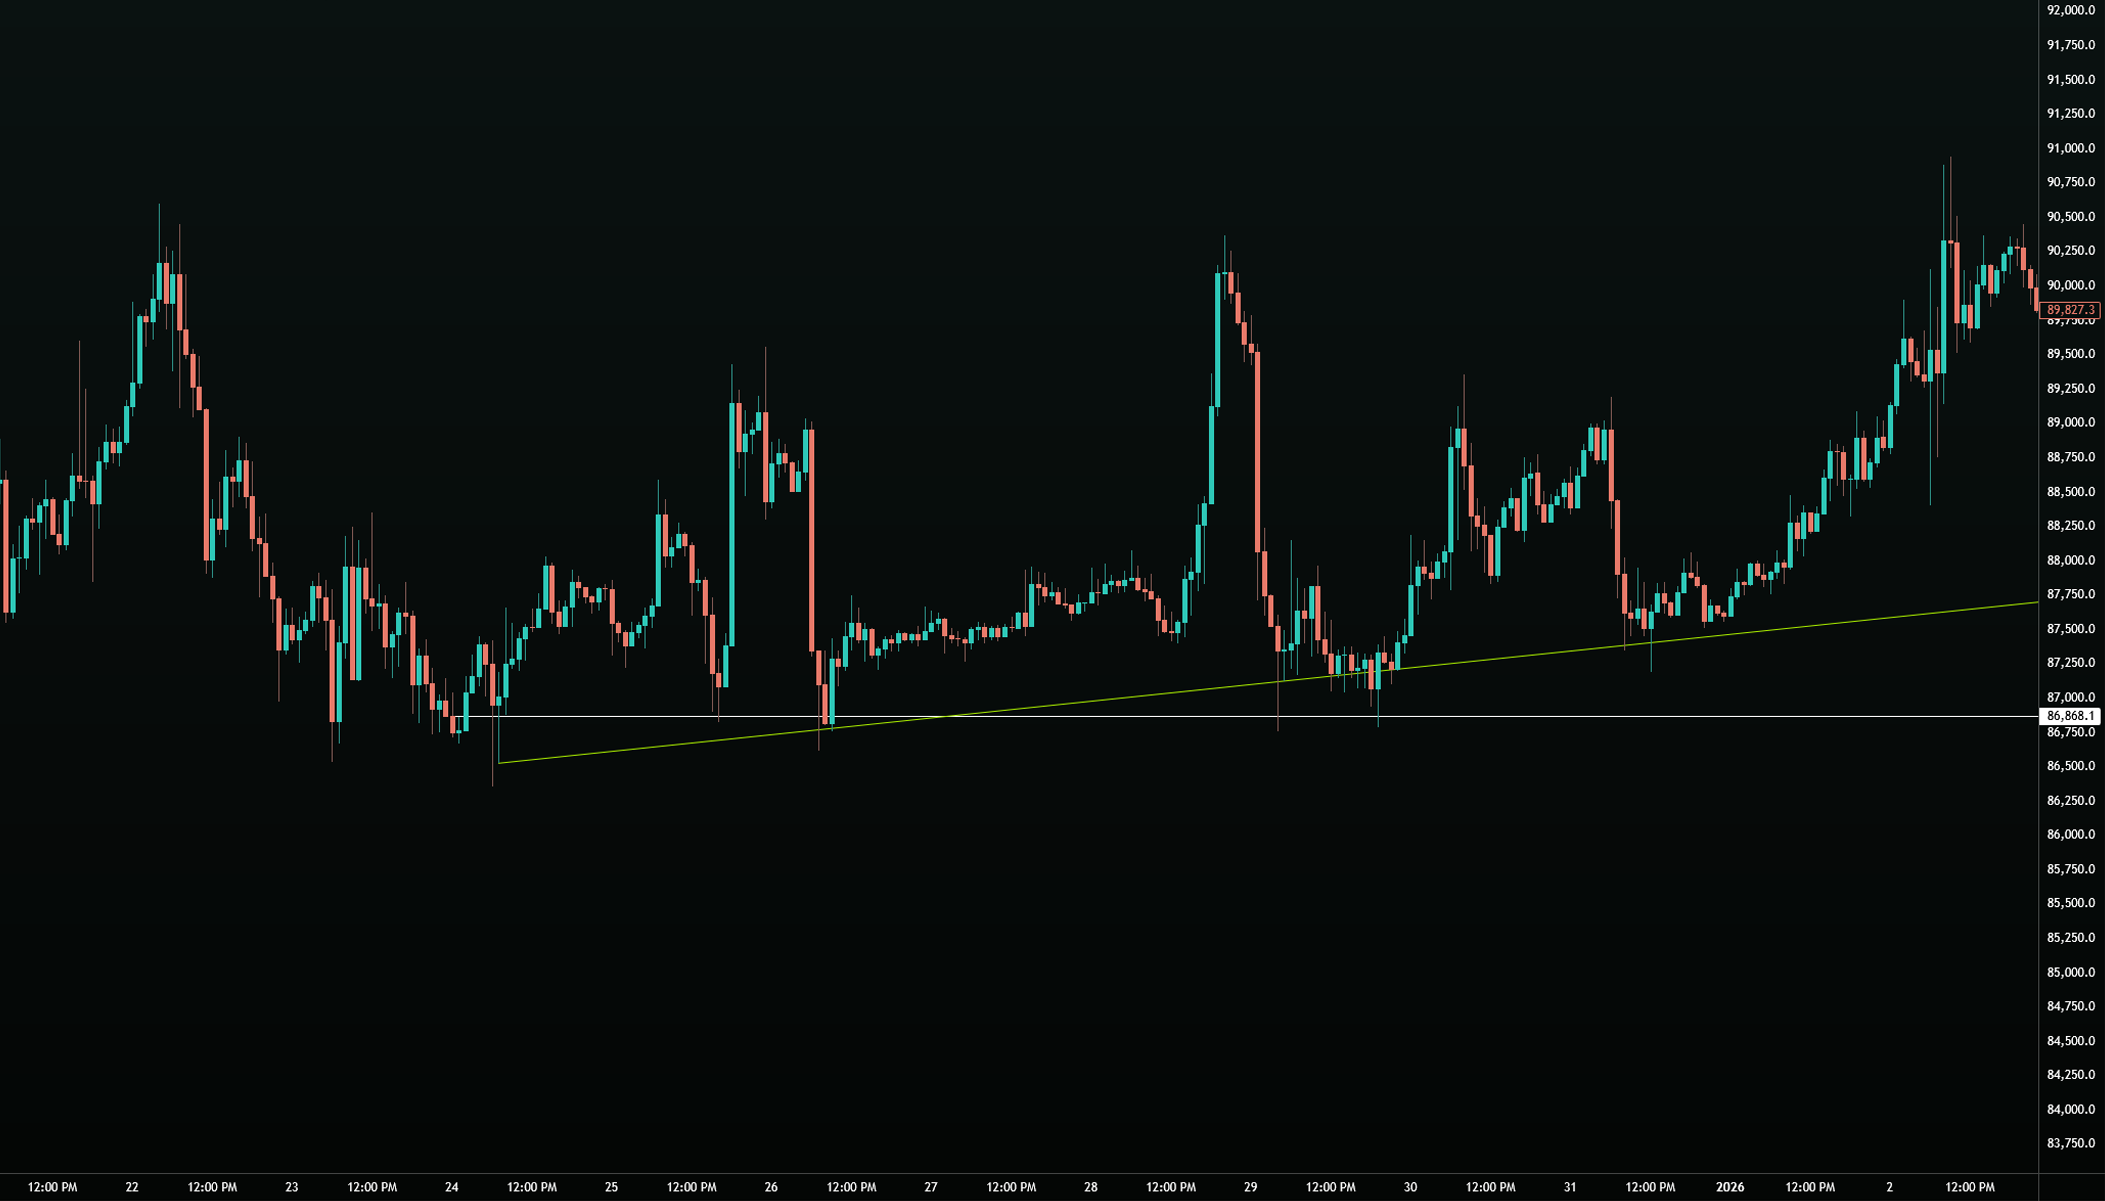
A range might span from a Break Level at 72,000 to a Hold Level at 68,500. Inside that range, a Range Trend connects three separate hold-level touches on the bottom boundary over several sessions. When price finally breaks below that Range Trend — not just touches it, but closes below it with a Hard Close, which we'll talk about in a future session — the expectation shifts to the entire bottom of the range being challenged, and then potentially the range itself collapsing toward the next range down around 65,000.
Ranges should always be thought of as nested, and the current range is your trading environment. When a Range Trend within it breaks, you are not just losing a diagonal line — you are getting information about which direction the range is likely to go. If the bottom Range Trend breaks, the bottom of the range is being attacked. If you additionally lose the bottom of the range, you are now in the next range below. This is the Ladder effect — each broken structure sends price to the next structural level.
06 - RATs
What we need to understand about Rejection as Target is it's a Hold Level before it is created. This is important because it allows us to take trades where we can get into the price before we know what's happening next, which starts to bridge us into a more advanced theory, and reduced risk.
RAT (Rejection as Target) is any existing candle that is in the process of forming a Hold Level yet hasn't gotten above the body. The exact crossover point where the body of a candle is a Hold Level is the RAT. Below the Hold Level, that exact crossover point is the Rejection — so anything below that crossover point is a RAT, anything beyond that crossover point is a Hold Level. Prior to it being a Hold Level it must get over top of — or below — the body of the candle that defines the Hold Level. This allows you to identify a future Hold Level and position yourself in a trade before it's created. Rejection as Target is both a predictive tool and a precision entry mechanism.
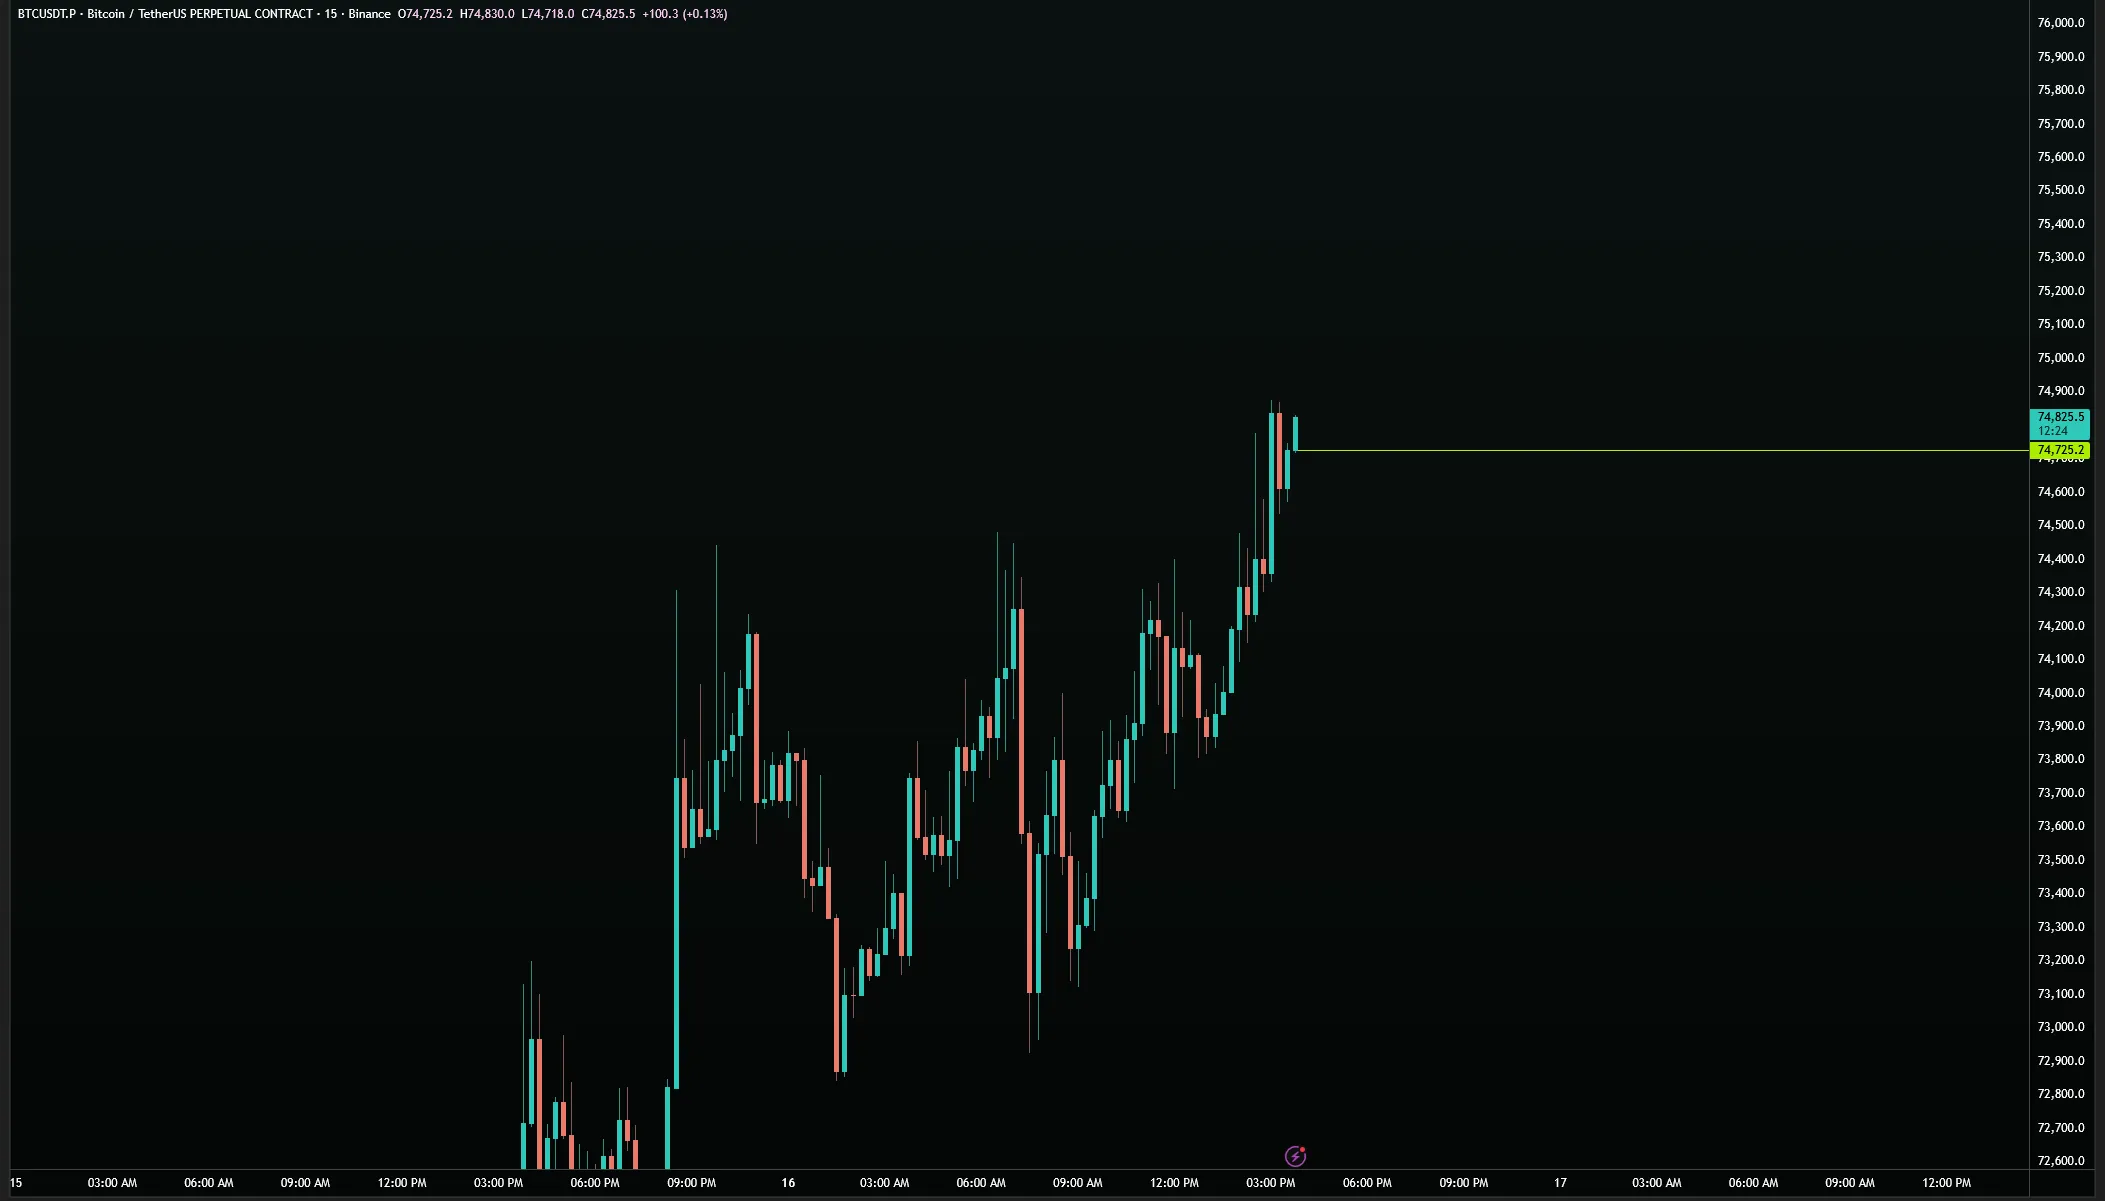
The premise of a RAT is straightforward: if Hold Levels hold price and every valley and peak on every timeframe has a Hold Level, then the moment you can identify that a Hold Level is being created, you have identified a future rejection point. That future rejection point is the target. Getting underneath it, or above it depending on direction, before the Hold Level is officially created allows for entries that would otherwise require waiting for a test after the fact.
A RAT exists at every timeframe simultaneously. A one-minute RAT, a 15-minute RAT, a one-hour RAT, a four-hour RAT, and a daily RAT can all exist at the same time on the same chart at different price levels. The distance to the next untested level differs by timeframe — a four-hour RAT target is typically much further from current price than a one-minute RAT target. This distance difference is what traders mean when they refer to one timeframe being "stronger" than another: larger distances between levels require more time but produce larger moves.
Time equivalence is a key concept within RATs. A four-hour RAT may produce a larger percentage move than a one-minute RAT, but it also takes significantly longer to reach. A one-minute RAT may produce a small percentage move quickly. When all timeframes are operating together correctly, a trader can use a smaller-timeframe RAT as the entry mechanism to gain a larger-timeframe RAT — entering at the smaller level and riding the move toward the larger target.
Let's say a four-hour Hold Level is forming at the current price. Underneath it, there is a mechanism to enter — perhaps a one-minute Hold Level is supporting the area. You enter using the one-minute Hold Level as your entry point, setting your stop loss at a price that would break that one-minute level. Your target is getting above the four-hour Hold Level acting as RAT. If everything holds, you gain the four-hour RAT and price moves upward toward its next target without you needing to wait for a re-test.
The size of the timeframe directly correlates to the distance between RAT levels, not to some abstract notion of "strength." A four-hour RAT is 2.3% from its next level. A one-hour RAT might be 0.5% from its next level. A five-minute RAT might be 0.1% from its next level. These are not differences in power — they are differences in distance and time. Each timeframe provides exactly what it is designed to provide: a level of the appropriate distance for trades of the appropriate duration.
RAT logic connects to the broader system at multiple points. A RAT that becomes a Hold Level is also, by that same nature, a rejection-as-target for the next timeframe above it. When you gain a four-hour RAT and price begins to push above the Hold Level you just bought, that Hold Level transitions into a RAT for the next move. Each successfully tested Hold Level becomes the foundation for the subsequent RAT above or below it.
In practical charting, you will find RAT setups by identifying the most recently formed Hold Levels on each timeframe and noting whether they have been tested. Any untested Hold Level is, by definition, a RAT — it will eventually be approached, and when it is, it will reject price and send it in the opposite direction (or it will be broken, which is different information entirely). Keeping a clear list of untested Hold Levels by timeframe is equivalent to keeping a list of active RATs.
The highest value RAT setups occur when multiple timeframes converge at the same price point — a one-minute RAT nested inside a five-minute RAT nested inside a 15-minute RAT, all at the same price level. This convergence multiplies the probability that the level will hold and produce a significant move. The combination lesson covers how to identify these convergences methodically.
07 - How to use it all S1
Combining all these theories is the first step towards understanding Technical Analysis. Your success up to this point relies on your ability to realize that charts are simply just data points that can be interpreted to show us truths based on a decycling mathematical system. Our objective is to remove possibilities through data points. The same concept would be removing nodes from a decision tree — when you remove a possibility you reduce total outcomes.
Section One introduced six core marks: Hold Levels, Break Levels, Origin Levels, Trends, Range Trends, and RATs. Each of these answers one specific question about the chart. Together, they build a complete structural picture of where price is and where it can go next. This integration lesson demonstrates how to use them together.
The starting point is always the same: identify what was last hit. Was it a Hold Level? Was it a Break Level? The answer to that question determines the structural context for everything else. A chart that last tested a Hold Level is structurally positioned to continue in its current direction. A chart that last tested a Break Level is attempting to change direction. From this single determination, all subsequent analysis flows.
Once you know what was last hit, you look for what exists between current price and the next significant level. Are there untested Break Levels between here and the potential target? If so, they must be cleared before price can reach the target. Are there Hold Levels that could stop the move before it reaches the Break Level? Identify them. Then look at whether the Break Level on the far side has been tested — if it has not, that is a structural argument that the chart cannot reverse without first testing it.
A Break Level that has never been tested means the chart technically cannot move against its current direction without first processing that untested Break Level. This is not a guarantee — other factors can intervene — but it is a structural truth. An untested Break Level on the top side of the chart in an uptrending environment means the chart has not yet been told it can go down. As long as that Break Level remains untested, the bias stays upward.
Origin levels — Break Levels that have been tested twice — act as polarity inside the analysis. When you identify an origin level between current price and a potential target, you need to account for what happens when price reaches it. If price is above the origin level, that level should support price. If price is below the origin level, that level should resist price. The chart has divided itself at that point, and the origin level tells you which side has structural advantage.
Range trends add a third layer: they tell you whether the broader structure of the range is intact. If the range trend is holding, the range boundary is secure. If the range trend is being tested from the correct side and holds, that is further confirmation of the directional bias. If the range trend breaks, the range boundary is under threat, and the entire lower structure of the range is now vulnerable.
RATs allow you to read the chart ahead of time. As you work through all the above analysis, you identify the ungained Hold Levels on each timeframe. Those are your active RATs — the points where price is likely to reject, or project. Setting your entries near RATs, with logical stop placement is the practical application of everything Section One teaches.
Not every theory is needed on every trade. The right tool for the situation is the one that provides clarity. A trade where a simple Hold Level with a RAT entry and a clear untested Break Level as the target is straightforward does not require every add-on or secondary indicator. Forcing additional analysis onto a clean setup can obscure the signal rather than sharpen it. Use what the chart gives you, not what you want to find on it.
The purpose of this integration approach is to build a habit of sequential reasoning. Start with what was last hit. Determine what that means for direction. Find what stands between current price and the next major level. Identify RATs that allow for precise entry. Check whether origins and range trends confirm or complicate the picture. Place the trade with logic-defined stops and targets — not guesses. Every variable in the analysis has a specific answer. The system exists to find those answers in order.
08 - +1/-1
+1/-1 is a system that creates relativity within Levels. There are many ways to use the term +1/-1 as it's a system that reveals strength and can be applied in various ways. At its core +1/-1 allows us to understand what's breaking on the charts before it happens.
- One application of +1/-1 is when a level that can turn into polarity is hit more than once — it goes up one timeframe in strength. For example, the second time a 15-minute Break Level is hit, it turns into an hourly level as an Origin.
- A separate example would be used communicatively: "We hit the 15-minute level so if we target a -1 we will break up." The -1 here refers to a weaker level, one timeframe lower than what's in question — a 5-minute level.
+1/-1 is the system for tracking when a level gains or loses a timeframe. Plus-one means a level has polarized — it has moved one timeframe up from where it was created. Minus-one identifies the timeframe that can offset a polarized level — the timeframe one step below it that can hold or break the move in the opposing direction.
Every polarized point on the chart — origin levels, Reverse Levels, trends that have been tested twice, and any other level that has created polarity — automatically gains a plus-one designation. This means that when you have a one-hour origin level, you are actually dealing with a four-hour level. When you have a 15-minute origin level, you are dealing with an hourly level. The plus-one label communicates this timeframe elevation clearly.
The timeframe progression used in this system is fixed: one-minute, three-minute, five-minute, 15-minute, one-hour, four-hour, daily, weekly, monthly. No other timeframes are used. The cycling nature of the science only operates correctly within these specific intervals. Using any intermediate timeframe — two-minute, six-minute, two-hour — breaks the mathematical formula. These nine timeframes are the only valid timeframes.
Plus-one applies only to polarized levels. Not every level gains a plus-one. Only levels that have achieved polarity — origin levels, Reverse Levels, and trends tested multiple times — carry the plus-one designation. Minus-one, however, applies to every level on the chart, regardless of polarity status. Every single mark you make can have a minus-one applied to understand what offsets it.
Minus-one tells you what can offset a level and hold the move in the opposing direction. If you have a four-hour level (a plus-one from a one-hour origin), the minus-one to that four-hour is the one-hour level. A one-hour Hold Level, if it holds, offsets the four-hour and tells you the chart is continuing in the direction the four-hour supports. If that one-hour Hold Level fails — if price breaks through it instead of bouncing — the four-hour level is no longer being supported and is likely to break.
The practical value of plus-one minus-one is prediction architecture. When you know you are dealing with a four-hour level, you know what would need to happen at the one-hour timeframe to support that four-hour. You look for one-hour Hold Levels between current price and the four-hour target. If the one-hour Hold Levels are present and untested, the move toward the four-hour target has structural support. If the one-hour Hold Levels are already tested or absent, there is nothing to hold the move and the four-hour level will be reached quickly.
The chain extends both ways. A daily level has a four-hour minus-one. If the four-hour Hold Level exists and holds, the daily is being offset — supported by the one-timeframe-below confirming the move. If the four-hour Hold Level fails, the daily gets confirmed as the target. The same logic applies going down: the four-hour's minus-one is the one-hour, the one-hour's minus-one is the 15-minute, and so on all the way to the one-minute.
A daily Hold Level was recently hit. The minus-one to daily is four-hour. You look for four-hour Hold Levels between current price and your next daily-level target. You find one. That four-hour Hold Level holds and confirms: the chart is continuing toward the daily target. Now you look at the four-hour's minus-one: the one-hour. A one-hour Hold Level exists, holds, and confirms the four-hour move is sustained. You now have a chain: daily target confirmed by four-hour hold, four-hour hold confirmed by one-hour hold. This chain is what high-confidence trades look like.
Plus-one and minus-one are not just analytical labels — they change which levels you look at and how you interpret their behavior. Without this framework, a Break Level on the one-hour chart might be treated as just a one-hour Break Level. With plus-one, if that Break Level has been tested twice, you recognize you are dealing with a four-hour structure in a one-hour body. The move potential and the offset requirements change accordingly.
09 - Combo levels
Combo Levels are the spots where connected levels drill down into lower timeframes to find higher amounts of accuracy. You can find Combo Levels by starting with the wick of your highest timeframe level, mark it and move down exactly one timeframe to mark the wick of that -1 timeframe. Keep doing this until you have no more levels to move down — and that's your greediest entry within a Combo Level.
- A rule is you cannot go candlesticks backwards — they must always be forwards in time as you continue going down in timeframes. They can't be forward and up. They can't be backwards and down. They must be forward and down.
- If you start marking Combo Levels and all of a sudden there are no Hold Levels left to mark, then your Combo Levels are done — and you're at the final point for that Combo Level.
A Combo Level (Combination Level) is a trail of connected levels descending through timeframes toward the same price point. Starting from a higher timeframe level, you move down and forward in time through successively smaller timeframes, identifying the level on each timeframe that still connects to the original. The deepest connected level is the combination level — the most accurate entry point for a trade on the original higher timeframe target.
The purpose of a Combo Level is precision. A four-hour Hold Level is a wide target — the difference between the body and the wick can be significant in percentage terms. By cascading down through timeframes to find where that four-hour level's structure ultimately terminates at the one-minute or three-minute level, you identify the most accurate possible entry point. Getting into a four-hour trade at a one-minute Combo Level means you are entering within fractions of a percent of the theoretical perfect entry.
The rule for Combo Levels is strict: each successive timeframe level must be forward and down from the previous one. Forward means the candle used must be at a later timestamp than the candle on the level above it. Down means it must be at a lower price than the level above it (for bottom-side combos). Backward means the candle exists before the previous level's candle in time — this is a disconnection and the chain stops there. Any chain that requires going backward in time is invalid.
To find a Combo Level: start with the highest timeframe level you have identified and mark the wick. Go to the next timeframe down and find the wick of the level closest to the same price that is forward and down from the higher timeframe candle. Continue cascading down until you either find the final timeframe or reach a disconnection. At that point, mark the body of the last candle. A disconnection occurs when the next timeframe level would require going backward in time or would not exist at all. Stop at the last valid connection — that is the Combo Level.
Combo Levels follow the same nine-timeframe sequence: four-hour, one-hour, 15-minute, five-minute, three-minute, one-minute. Not all chains will reach one-minute — some will stop at five-minute or three-minute if the lower timeframe levels are either already tested or do not connect forward and down. The depth of the combo chain tells you how much precision is available for the trade. A chain that stops at 15-minute gives you one level of precision. A chain that reaches one-minute gives you maximum precision.
If a timeframe level in the chain is already tested, it is excluded. You cannot use a tested level as a Combo Level entry. The combo trail stops there and you are at your final Combo Level.
A four-hour Hold Level exists. Moving to the one-hour: there is a one-hour level that is forward and down from the four-hour candle. Not tested. Valid. Moving to the 15-minute: there is a 15-minute level forward and down from the one-hour candle. Not tested. Valid. Moving to the five-minute: the five-minute level is forward and down. Not tested. Valid. Moving to the three-minute: it connects forward and down. Valid. Moving to the one-minute: the one-minute level exists and connects. Not tested. This is the Combo Level — the one-minute entry for the four-hour trade.
When the same price appears at two consecutive timeframes in the combo chain, they are the same candle seen at different resolutions. In this case, the chain continues as long as the level is not tested — being at the same price does not represent a disconnection. The chain only disconnects if the lower timeframe candle would require going backward in time relative to the higher timeframe candle.
In practice, Combo Levels are used by setting your entry at the deepest valid timeframe in the chain. Your stop logic is defined by what would break that smallest timeframe level. If the Combo Level holds, the entire timeframe chain above it is simultaneously supported and you ride the move toward the original four-hour (or higher) target. The combination of precision entry with higher-timeframe target produces the tightest risk-to-reward configurations available in the science.
10 - Hard close
Hard Closing is the mechanism we use to confirm when a level is no longer useful and should be removed off of our charts.
- To Hard Close a level, two things must happen: first, you need to close both sides of the candle body across the level; and second, it must be the same color candle as the direction it is traveling.
- If you're moving up, it must be a green candle that closes both sides of the body over the level. If you're moving down, it must be a red candle that closes both sides of the body below the level.
A Hard Close is when a candle closes with both sides of its body — the top and bottom — on a specific side of a level. On the bottom side of a chart (below a level), a hard close requires a green candle to close with its bottom above the level. On the top side (above a level), it requires a red candle to close with its top below the level. A hard close signals that the level can be removed from the chart and treated as closed.
Understanding hard closes is essential because it defines when a level is no longer active. A level that is deep-dived — where price goes through it momentarily but does not hard-close — remains on the chart as a valid target. A level that is hard-closed has been processed and should be removed. Without this distinction, your chart will accumulate levels that are no longer valid and obscure the true structure.
The color of the closing candle matters as much as the position of its body. A Hard Close on the bottom side of a chart requires specifically a red candle — the candle that is moving down in the direction of the move. A green candle going below a level on the top side does not constitute a Hard Close. The closing color must match the direction of the move. This inverse logic appears throughout the science: everything on the top side mirrors the bottom side, but in the opposite color.
A hard close does not require the entire candle to be on the closing side of the level — only the body. The wick can extend through the level. If the body closes above the level (for a bottom-side hard close) or below the level (for a top-side hard close), the hard close criteria is met. The wick extending through the level into the opposite zone does not invalidate the close.
When a level is hard-closed, it transitions to become a new Hold Level at the closing candle's position. The mechanism by which Hold Levels advance forward on the chart as a move progresses works as follows: The old level is removed. The body of the candle that hard-closed it becomes the new Hold Level at its position. This creates the ongoing trail of Hold Levels that tracks the move forward in time.
The absence of a hard close is equally informative. A level that price has approached, touched, and moved through temporarily — without closing a candle with both body sides on the appropriate side — is still active. That level will be available as a target again in the future. Specifically, it becomes what is covered in the next lesson as a deep dive: a level that can be used as a Reverse Level because it has not been officially closed.
Hard closes also have a timing component: the hard close must be on the same timeframe as the level being closed. If you have a four-hour level, the hard close must occur on a four-hour candle — a four-hour candle closing with both body sides on the appropriate side of the level. A lower timeframe candle hard-closing through a higher timeframe level does not qualify. The timeframe match is required.
A 15-minute Hold Level exists at a specific price. Price is going up to approach it, the wick touches the level (which tests it), and the candle closes with its body entirely below the level on a green candle. The bottom of the green candle body is below the level — this is not a Hard Close. The level is kept on the chart.
11 - Deep dive
A Deep Dive is when price goes way past the level but doesn't Hard Close it.
- Deep Dives can happen at any level on your charts. Break Levels, Hold Levels, Origins, Trends — it can happen at any level interaction and will sometimes apply +1, based on the level type.
A Deep Dive occurs when price moves through a level without hard-closing it. Price goes past the level in either direction but the candle body does not close on the other side of the level. Because no hard close occurred, the level remains valid and can be used as a Reverse Level in future price action.
The deep dive is the natural companion to the hard close lesson. Understanding when a level is closed versus when it has only been temporarily violated is critical for keeping your chart accurate. Deep dives happen constantly — price will spike through a level on a wick, fail to close there, and return. If that deep dive level is removed prematurely, you lose a valid future trade setup.
A deep-dived level that remains on the chart (because it was not Hard Closed) functions as a Reverse Level. When price returns to that level in the future, the level will be available for use. It has already been tested once — the initial spike — and if it is approached again with appropriate candle separation, it can get a +1 level status. The Deep Dive is not a dead end; it is the start of a level's potential second and third acts.
The rule is simple: remove a level only when it hard-closes. Do not remove a level simply because price went through it on a wick. As long as the body of the candle on the applicable timeframe has not closed fully on the other side of the level, the level stays on the chart. Removing a deep-dive level prematurely is one of the most common accuracy errors.
Deep dives often lead directly to combination levels. When price deep-dives a higher timeframe level and then returns from the other side, it is typically in the process of finding the Combo Levels inside the deep dive range. The deep dive creates the structural context — the level is still active, the range to work within is defined, and the job is to find the precise timeframe within that range where the move will actually terminate and reverse.
One specific pattern to recognize: when a level has been deep-dived once and not Hard Closed, and price returns to it a second time with candle separation, that second test is the +1 creation moment. Two independent hits with separation means Polarity is being created on this deep-dive level. The Deep Dive was the first hit. The return is the second. At that moment, the level may transition from a simple Hold or Break Level to a polarized Reverse Level.
Deep dives create what are called ladder points when they appear repeatedly at sequentially lower (or higher) prices. Each deep dive that does not hard-close leaves a level on the chart. Multiple such levels in sequence create the staircase structure called a ladder. Ladders are covered in their own lesson but their foundation is the repeated application of deep dive logic: multiple levels present because none of them were hard-closed.
When a level is hard-closed, it is permanently removed. When a level is deep-dived without a hard close, it remains active indefinitely until it either achieves a hard close or transitions to origin/polarity status through repeated independent tests. Never clean up a chart by removing deep-dive levels. They are legitimate structural data points that price will return to.
12 - Global information
All charts are bound by their largest ranges, which diminish down into smaller ranges giving you bounding boxes to live within. When you exit one box you're in a larger box trying to escape. This is the meta of the market, and ranges we need to be aware of before entering them.
Global information refers to the highest timeframe structural data on the chart — the ranges, levels, and polarity that define the outermost boundaries of the move. Local information refers to the most immediate, close-range data within the current trading context. Every timeframe is simultaneously global to the ones below it and local to the ones above it.
The purpose of separating global from local is mental clarity during charting. When you are in a trade on the five-minute timeframe, your local range is defined by the five-minute levels immediately surrounding price. That five-minute local range, however, exists inside an hourly range, which exists inside a four-hour range, which exists inside a daily range. Knowing which ranges you are nested inside of tells you what happens when you break out of your local range.
A breakout of a local range is not the end of the move — it is the entry into the next range. When five-minute polarity breaks, price enters the 15-minute range. When 15-minute polarity breaks, price enters the hourly range. Each breakout simply transfers the action into the next, larger context. Understanding global context prevents the mistake of treating local breakouts as major events when they are simply transitions to the next nested level.
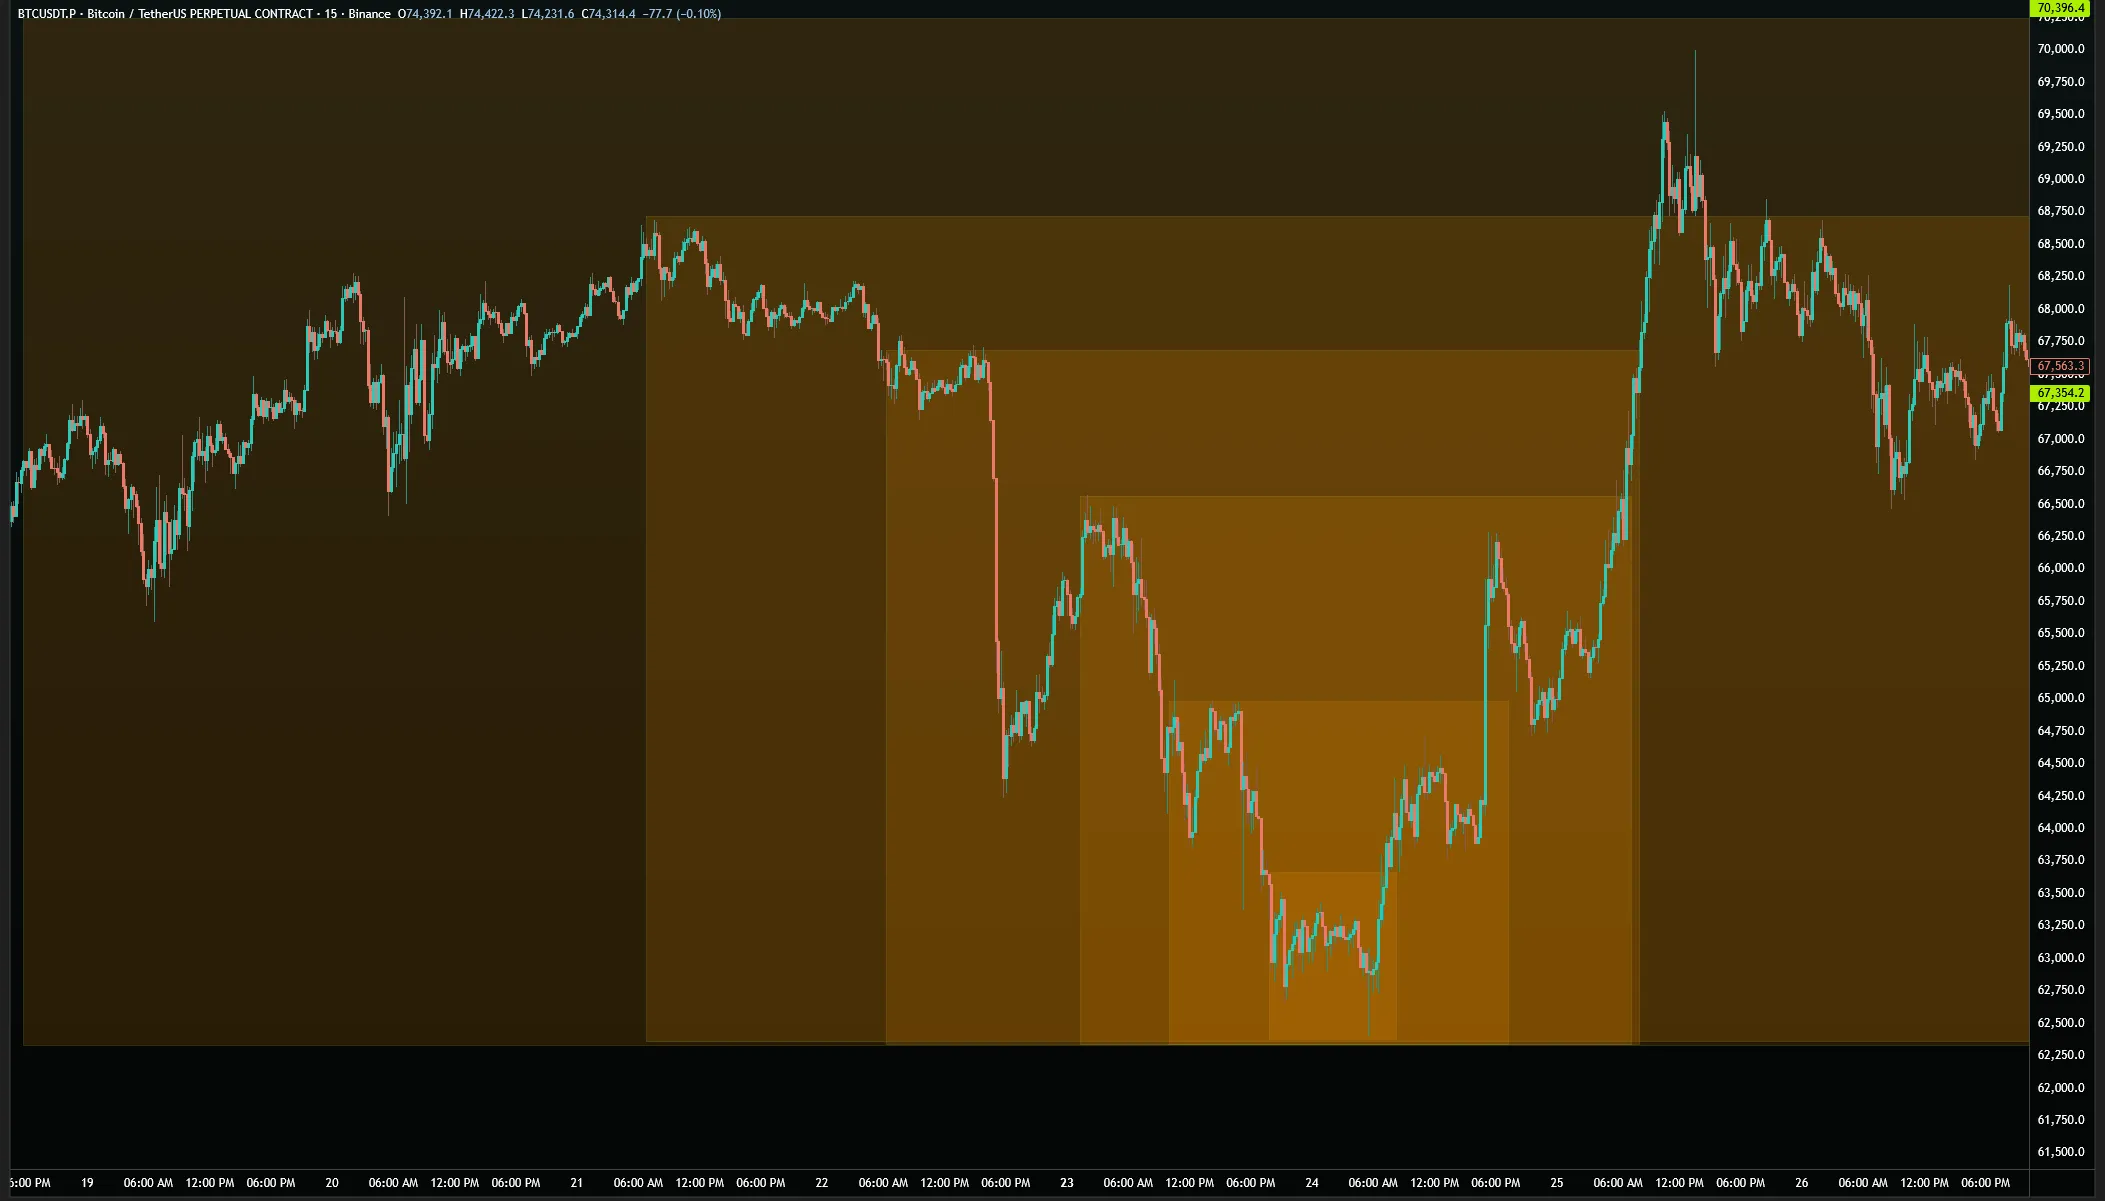
To identify global information: zoom out to the highest timeframe where you can still identify clear levels. Mark the weekly or daily levels at the top and bottom of the current overall move. These are your global boundaries. The range they define is the global range. Everything inside that range is local to it. As you zoom in and identify progressively smaller ranges, each one is local to the one above it and global to the one below it.
When a local range breaks, the next range up becomes the new relevant local context. Price does not travel from a five-minute range directly to a daily range in a single move. It transitions: five-minute to 15-minute, 15-minute to hourly, hourly to four-hour, four-hour to daily. Each transition is triggered by the polarity of the current range being broken. This chain of transitions is the mechanical path of large moves.
The most critical mistake in global and local analysis is treating them as fixed categories. Global and local are relative designations. If you are trading daily ranges, your daily levels are local and your weekly levels are global. If you step up to trading weekly ranges, your weekly is now local and your monthly is global. Always define your reference frame before labeling anything as global or local — the labels are only meaningful within a defined reference frame.
Global information controls the eventual targets of any move. If a local range breaks, the next target is defined by global structure — specifically, the next untested level in the global range above the local range that was just broken. Having global levels marked on the chart even while trading locally is non-negotiable. The moment local polarity breaks, you need to know immediately where global structure says the next stop is.
Practically, global and local structure together tell you when a trade has reached its maximum potential within the current context. If price is approaching the top of the global range from the local side, the trade is nearing its structural limit within that global range. The target might be exactly at the global boundary. Understanding this prevents the mistake of setting targets beyond what the current global structure can support.
13 - Inverse levels
An Inverse Level expresses the same level, or therefore mentioned on the opposing side of the chart. Inverse Levels are our first form of mechanical training known as Drills. Your eyes should constantly be scanning the charts for Inverse Levels to tie the current levels in question to Ranges and Logic Flow.
An Inverse Level refers to the level on the opposite side of the chart from the one currently being discussed. If you are looking at bottom-side Hold Levels, the inverse Hold Level is the corresponding level on the top side. If you are looking at a bottom-side Break Level, the inverse Break Level is on the top side. Inverse is a directional descriptor, not a different type of level.
The term inverse exists primarily as a communication tool. When someone says "mark your inverse four-hour level," they mean mark the four-hour level on the opposite side of the current discussion. If the current focus is on the bottom of the range, the inverse is the top. If the current focus is on a specific level at a given price, the inverse is the untested level at the corresponding position on the other side of the chart.
The most useful application of inverse level thinking is in range analysis. Every range has a top and a bottom. The levels at the top are the inverse of the levels at the bottom. When you hold the bottom of a range, you will be targeting the inverse levels at the top. When you lose the bottom of a range, the inverse relationship tells you where price is likely to back-test from above before continuing lower.
Inverse thinking applies at every structural level. An inverse Break Level is a Break Level on the top side. An inverse Hold Level is a Hold Level on the top side. An inverse origin is an origin on the top side. An inverse trend is a trend on the top side. In every case, "inverse" simply means you have flipped your perspective from one side of the chart to the other.
You are working with bottom-side levels on a chart and have identified several Hold Levels and Break Levels. Someone asks you to find the next untested inverse four-hour level. You shift to the top side of the chart and look for the four-hour level — hold or break, depending on context — that has not yet been tested. That is the inverse four-hour level. It is not a different category of level; it is the same type of level, on the other side.
The day trading sciences always operate in opposites. Red holds on the bottom, green holds on the top. Green breaks on the bottom, red breaks on the top. Origins on the bottom create polarity that attracts price from below; origins on the top create polarity that attracts price from above. Inverse terminology is simply the formal acknowledgment of this symmetry. What works on one side of the chart has a mirror image on the other side.
Inverse awareness becomes critical in Pandora's box situations, covered in a later lesson, where the chart is between two equal and opposite levels and the direction has not yet been determined. In that scenario, the inverse levels — the equal levels on both sides — are the boundaries of the uncertainty. Which inverse level gets processed first determines the resolution of the indeterminate state.
14 - Ladders
Ladders are all about the wicks of moves on the top and bottoms of your charts. A great way to think of ladder points are the wicks that allow Trends to be created must continue to apply pressure.
A Ladder is a sequence of wicks — that are progressively stacked in the direction of the current move, with none of the wicks having been moved below on consecutive attempts. Each wick of the ladder represents a price point that was created as the move progressed and that has not been moved below since. Ladders represent ranges within the current trend. If a move continues to ladder it will continue to move in that direction.
The visual metaphor is precise: a ladder going upward has wicks at progressively higher heights. In a bullish ladder, each successive wick is higher than the last, and none of the lower wicks have been tested from above (which would indicate price came back down through them). As long as all wicks remain untested, the ladder is intact. The moment price wicks below the all ladder points the ladder is broken.
Ladder points are critical because they represent Trends, and Range Trends continuing to hold price in the same direction. A ladder of untested Break Levels above the current price (in a downtrend) means the chart literally cannot reverse upward without first breaking its ladder. This is the structural proof that the move must continue before it can reverse.
When a ladder breaks — when all of the wicks have had price push past them — it has begun testing in a way that suggests direction change. The broken ladder wicks are not deleted; they are adjusted as long as the first master wick that is lower than the rest, and the master wick still remains the lowest wick. The break of a ladder is the first signal that the range may be shifting.
Ladder points are inherently connected to ranges. Each ladder wick defines a local range boundary. The entire staircase structure, wick by wick, maps out the progression of ranges within the larger move. When you view a ladder as a series of Nested Ranges — each wick the top or bottom of one sub-range — you can see exactly how the move is constructing itself: one small range at a time, with each wick representing the boundary of the previous range before it was broken and the next range began.
The relationship between ladder points and Break Levels is what gives ladders their structural significance. Most ladder wicks, at their creation, were a Break Level. Break Levels that have not been tested from the opposing side are actively suppressing any potential reversal. An uptrending chart with multiple untested Break Levels above it on each timeframe is a chart that structurally cannot reverse until those Break Levels are tested. Marking those Break Levels — the ladder wicks — makes this suppression visible.
Once a ladder breaks, the chart is no longer guaranteed to continue in the original direction. The break of a ladder wick triggers a reassessment: are we now in a new range, or is this a temporary violation? The test of the broken wick from the opposite side will determine whether it gains origin status (becomes Polarity) or whether it was a simple Deep Dive. If it achieves origin status, the range has officially shifted. If it remains a Deep Dive, the ladder may reform above the violated wick.
A bullish move has created five ladder rungs — five progressively higher Hold Levels, all untested from above. The chart is in the fifth rung when one of the lower rungs (rung three) is tested from above for the first time. Rung three has been violated. The ladder is broken. Whether the chart can recover and resume the original trajectory depends on whether rung three now becomes an origin level (two independent tests with separation) or whether price re-establishes above it without a second test. The ladder break is the decision point.
15 - Movable and open trades
I like to call them open trades because it just sits there open until it gets hit. A movable trade is something that happens below Polarity and inside of a range. Open trades should go on polarized moments on the chart, or on spots you know a level that's going to hold you down for sure. These are open trades. They mean that you should always leave them open and you shouldn't be taking them down. If you do decide to move an open trade just delete the trade altogether and re-assess if it makes sense at a different level instead.
Moveable & Open Trades is a classification system for how you manage your trade entries. An Open Trade is one where you have high confidence that the level will be hit regardless of intermediate price action — it stays on your chart at a fixed price and is never adjusted. A Moveable Trade is one where the exact entry price is subject to change based on developing conditions — it can be adjusted as the chart reveals new information.
The distinction between moveable and open trades is ultimately about confidence. An open trade is placed on a polarized level — a level where you believe the structural significance is so high that it will be reached regardless of what happens in the meantime. You set it at that price and leave it. If your reasoning about that level changes, you do not adjust the open trade — you delete it entirely. Moving an open trade is a sign that confidence in the original thesis has been lost.
A moveable trade, by contrast, is placed inside a range on non-polarized levels. These are working entries — Hold Levels and Break Levels of lower timeframes that you are adjusting in real time as the chart develops. When new information reveals a more accurate entry point, a moveable trade is updated to reflect that information. Adjusting is not uncertainty — it is the normal process of integrating new data as the chart reveals it.
If you find yourself moving an open trade, delete it instead. The act of moving an open trade means the original thesis — that this polarized level would definitely be hit — has been compromised. Rather than chasing the trade by moving the price, step back, reassess whether the level is still the correct one, and if so, re-enter it as a fresh open trade. Do not let an open trade become a moveable trade.
Open trades live at polarity points: origin levels, Reverse Levels, significant range boundaries, and other structurally polarized locations. These are the places where the chart has already demonstrated that it divides into two distinct zones. An open trade at polarity is saying: when price reaches this polarized level, it will either continue in the established direction or break definitively in the other direction — and you have a position ready for that moment.
Moveable trades live inside the range — at the Hold Levels and Break Levels between the current price and the next polarity point. As price moves through the range and tests these levels, the relevant entry point for the next segment of the move changes. Moveable trades are updated to stay at the most relevant current entry point, not at an entry point that was valid two moves ago.
The psychological benefit of the open trade / moveable trade distinction is significant. Open trades require you to commit fully to a thesis — you either believe in the level completely or you do not trade it. This prevents the mental drain of constant second-guessing at significant levels. Moveable trades acknowledge that precision increases as the chart reveals itself — you are not committing to a final price, you are committing to a logic, and the price expression of that logic updates as conditions change.
When polarity on the chart breaks — when an origin level or range boundary is definitively breached — any open trades that were set at levels inside the broken zone should be reassessed. The structural conditions that justified those open trades may no longer apply. Reassessing them is the clean-up step that prevents holding stale open trades that have lost their logical foundation.
16 - Pandora's box
It doesn't matter if we want to make things all things equal. Wick to wick, or body to body; a Ladder is forming with a Break Level beside it. All of a sudden we have a whole Range Trend protecting the break, just like we have a Hold Level protecting the Range Trend. This is a Range, a bounding box that has yet to decide if it will break up or down. This is what a Pandora's Box is. When you're in a Pandora's Box, you are saying, I don't know which direction I'm going. You use timeframes, +1/-1, Trends, Levels of all types, theories — all to see what's next and how to escape this Pandora's Box.
A Pandora's Box is a state of structural ambiguity on the chart where equal levels exist on both sides of the current price range and it is not yet determinable which direction will win. Being in a Pandora's Box means both sides have equivalent structural weight and a resolution requires waiting for one side to definitively break.
Pandora's Box states are extremely common. Any time you have a Hold Level at the top of a range and a Hold Level at the bottom of the range — both untested — with price between them, you are in a Pandora's Box. The chart has equal claims pulling in both directions. Until one side is broken — specifically, until either the top Hold Level or the bottom Hold Level is definitively cleared — the direction is unknown.
Pandora's Box can exist at multiple timeframe levels simultaneously. A local five-minute Pandora's Box can be nested inside a global four-hour Pandora's Box. The resolution of the local box determines which direction the global box will trend toward next, but it does not resolve the global box by itself. Each level of Pandora's Box must be resolved through its own timeframe before the full directional picture becomes clear.
When in a Pandora's Box, do not attempt to predict direction. Instead, focus on identifying which levels exist on each side and what would need to be true for each side to win. The first question is always: what is holding each side up? Identify the Hold Levels protecting each Break Level. The side whose Hold Levels break first is the side that will lose the Pandora's Box. Watch for Hold Level failures rather than trying to anticipate direction.
The way to trade through a Pandora's Box is by working from the global timeframe down to the local timeframe. Start with the outermost boundary of the box — the daily or weekly levels on both sides — and then step down into four-hour levels, then one-hour levels. At each timeframe, identify which side has the cleaner, more intact structure. As the timeframe gets smaller, one side will typically reveal more structural completeness, pointing to which side is more likely to break first.
Pandora's Box resolves through the +1/-1 mechanism. The timeframe one step below the box boundaries is the controller. If the controller timeframe can produce a Hold Level on one side that holds and prevents the Break Level on that same side from being tested, it offsets the box in that direction. The first controller-level hold that holds definitively is the first signal of which way the box will break.
When a Pandora's Box breaks — when one of the boundary levels is cleared — the result is typically a significant move toward the opposite boundary. The energy built up during the indeterminate state is released all at once when the resolution occurs. Large single-candle moves often occur at the end of consolidation periods for this reason: price was in a Pandora's Box, and resolving it involved a buildup followed by a sudden release of directional pressure.
Price is between two daily levels — a daily Hold Level at 68,500 and a daily Hold Level at 72,000. Both are untested from the current price position. Four-hour levels exist near both boundaries, protecting each side. The chart is in a daily Pandora's Box. To determine direction: look at which four-hour Hold Levels are most recently created and still intact. If the four-hour Hold Levels near the top (protecting 72,000) are already tested, but the -1 timeframe on the opposing side — the bottom side 1H — keeps holding against the 4H, the box is more likely to resolve upward. This remains an assessment, not a certainty — only the actual breaking of one side resolves the box definitively.
17 - Polarity
An Origin Level, Reverse Levels, Break Levels, Trends, and Range Trends are all forms of Polarity. The first way in which we can see where Polarity exists is a moment where any level is tested twice and holds. The moment that these levels get hit we open the possibility that upon multiple tests the prerequisite for Polarity is now a possibility. Remember: just because a level is hit twice doesn't mean it's Polarity — timeframes and Logic Flow are the deciding factor.
- What we are doing here is simply defining what Polarity looks like. You would have to go through all your timeframes and find all the different information to see where your levels get Polarized, and then you could find out which Polarized level makes a difference.
Polarity is the property of a level that causes it to divide the chart into two structurally distinct zones. When price is on one side of a polarized level, it has entirely different expectations and structural pressures than when it is on the other side. Polarity is created by any level that has been tested multiple times with appropriate separation — origin levels, Reverse Levels, trends tested twice, and certain range boundaries.
The visual mental model for polarity is a dividing line. On the upper side of polarity, the chart is in one structural zone with one set of expectations. On the lower side, it is in a completely different zone. When price crosses polarity — going from one zone to the other — it transitions between entirely different sets of directional pressures. The level itself becomes a boundary that price must actively maintain to stay in either zone.
There are multiple sources of polarity in any chart. Break levels that have been tested twice become origin levels — a form of polarity. Hold levels that have been tested multiple times become Reverse Levels — also polarity. Trends tested multiple times become polarized diagonal levels. Range trends that have been tested multiple times polarize the range boundary. Any level with repeated independent tests carries polarity, regardless of its original category.
When a polarized level breaks — when price definitively crosses to the other side — the move will attack one timeframe higher than what the polarized level was created on. An Origin Level that was created at the 15-minute (making it a one-hour level due to Plus-One) will, when broken, attack a 1H–4H structure. The break of Polarity does not go to the same timeframe. It escalates. Polarity breaks triggering timeframe escalation is the mechanism behind large directional moves.
Polarity works symmetrically. When price breaks above polarity, it will back-test that polarity from above before continuing. The back-test is the chart confirming that the broken polarity has now switched — what was resistance becomes support. If the back-test holds (price bounces off the former resistance from above), the polarity flip is confirmed and price continues upward. If the back-test fails (price drops back through the former resistance), the polarity break was not a true break and needs to be reassessed.
The cumulative effect of multiple polarity points stacked on the same chart is a progressively more defined range structure. Each polarity level defines one boundary of a sub-range within the larger range. Multiple polarity points effectively ladder the chart — each one is a range boundary that, when broken, reveals the next polarity level above or below it. Charts in strong directional moves display a series of polarity breaks that appear like stair steps.
Polarity points are the most valuable trade locations in the system. They represent the greatest concentration of structural significance — every test of a polarized level is a high-information event that reveals something definitive about the chart's structure. At polarity, you know exactly what a test means: either the level holds and confirms the zone, or it breaks and triggers timeframe escalation. There is no ambiguity at a properly identified polarity level. The ambiguity was resolved the moment it became polarity through its multiple tests.
Identifying all Polarity points on a chart is one of the most important preparation tasks before any trading session. Mark every Origin Level, every Reverse Level, every multiple-tested Trend, and every Range Trend that has been tested multiple times. These are the structural boundaries of the chart. The regions between them are where the local action happens. The Polarity points themselves are where the directional decisions get made.
18 - Masters and controllers
A master and a controller is much like a +1 and -1. It is just the same thing with different use cases. It has a different application because we need to be able to define the Ranges and timeframes to create logic in these Ranges. So you could actually just say Hold and Break Levels are the same as +1/-1, which is the same as Masters and Controllers. It is just showing us what is going to break and hold the charts. We use an application layer such as Masters and Controllers to understand what timeframes we're using for the range. We use the application layer of +1/-1 to understand what levels to target, and we use Break and Hold Levels to decide where to take trades.
Masters & Controllers is a labeling system for understanding the relationship between timeframes in a trade. The Master is always one timeframe higher than the Controller. The Controller is one timeframe below the Master. If the Master is a daily level, the Controller is a four-hour level. The Controller's job is to manage whether the Master breaks or holds.
A master is always going to be the highest timeframe in the Range, and your controller is always going to be one timeframe lower than your master timeframe. For example, if your master was a daily level, your controller would be a four-hour level.
The controller does the actual work. If you want to break a daily master, the first step is for the 4H controller to hard-close above that same 4H level on a four-hour candle. If you want to hold a daily master and move back down from it, you need the four-hour controller to produce levels that hold the chart down below the 4H level. The Master defines the target or boundary; the Controller determines whether that target is achieved.
To identify the master in any given trade: find the highest-timeframe polarized level that is relevant to the current range. That is the master. It does not change during the course of the trade unless polarity on the chart shifts. The controller is simply one timeframe below the master. It changes as the chart moves — the relevant four-hour levels (if daily is the master) will shift as new ones are created and old ones are tested.
To break a master: the master timeframe must hard-close above (green for a bullish break) or below (red for a bearish break) the master level on a master-timeframe candle — not a smaller timeframe candle. A one-hour candle cannot hard-close a daily master. The hard close must come from a daily candle closing on the correct side. Once the hard close occurs, the master is broken and the chart escalates to the next timeframe up for its new target.
Masters and Controllers makes range management precise. At any point in a trade, you can identify: what is the master, what is the current controller level, and what does the controller need to do to either break or hold the master? This gives you a specific list of conditions to watch. When those conditions are met, the trade resolves. Until they are met, the chart is still in the process of building toward the outcome.
The master-controller relationship also applies at smaller timeframes. A 15-minute master has a five-minute controller. A one-hour master has a 15-minute controller. The same logic scales to every timeframe. Whether you are managing a daily trade or a one-minute scalp, the mechanism is identical: identify the master, identify the controller, watch for the controller to either hold or hard-close.
The daily is the master. The four-hour is the controller. Four-hour Hold Levels have been successfully holding price from testing the daily level for several candles. The four-hour hard-closes above the 4H controller level. This confirms the controller has broken and an attack against the master is to follow. The next target is now between the broken 4H and the Daily master. If the Daily breaks, you need to look one range up to define your new Master Level.
19 - Reverse levels
Remember when we have an Origin Level it is one timeframe up when it hits a second time — therefore creating Polarity, and we already know that from the previous lessons. A Hold Level can contain that property as well: a hold needs to get hit once regularly or through a Deep Dive, and then when it gets hit a second time with at least one candle of separation, you have successfully created yourself a Reverse Level. A Reverse Level, like an Origin Level, is one timeframe up. Now, Reverse Levels combined with Deep Dives are great because they give you Range Trends when you have a Hold Level hit multiple times. Creating a Range Trend is an awesome benefit of Reverse Levels, but not their primary function. Their primary function is to act as one timeframe up when they get hit multiple times.
A Reverse Level is a Hold Level that has been independently tested multiple times — at least twice with candle separation — and has therefore gained polarity, elevating one timeframe. Where an origin level is a Break Level that has been repeatedly tested, a Reverse Level is a Hold Level that has been repeatedly tested. The mechanism is identical; the starting point is different.
Reverse levels are the Hold Level equivalent of origin levels. Both achieve polarity through repeated independent testing. Both elevate one timeframe when they achieve polarity status. Both create the same structural division of the chart. The distinction is simply which type of level was repeatedly tested: a Break Level creates an origin; a Hold Level creates a Reverse Level.
Reverse levels are also the original Hold Levels of a move — the first Hold Levels created at the beginning of a sequence. This is why the name "reverse" is used: these are the original positions where the move reversed from. They carry the historical significance of being where the reversal began. When a chart has both an origin (break-level polarity) and a Reverse Level (hold-level polarity) active in the same zone, that zone has double-layered structural significance.
The criteria for a Reverse Level matches the criteria for an origin level exactly: the Hold Level must be independently tested at least twice, with at least one candle of separation between each test. No consecutive testing without separation. The two tests must be distinct events. No hard close should have occurred between the tests either — if the level was hard-closed, it is no longer a valid candidate for Reverse Level status.
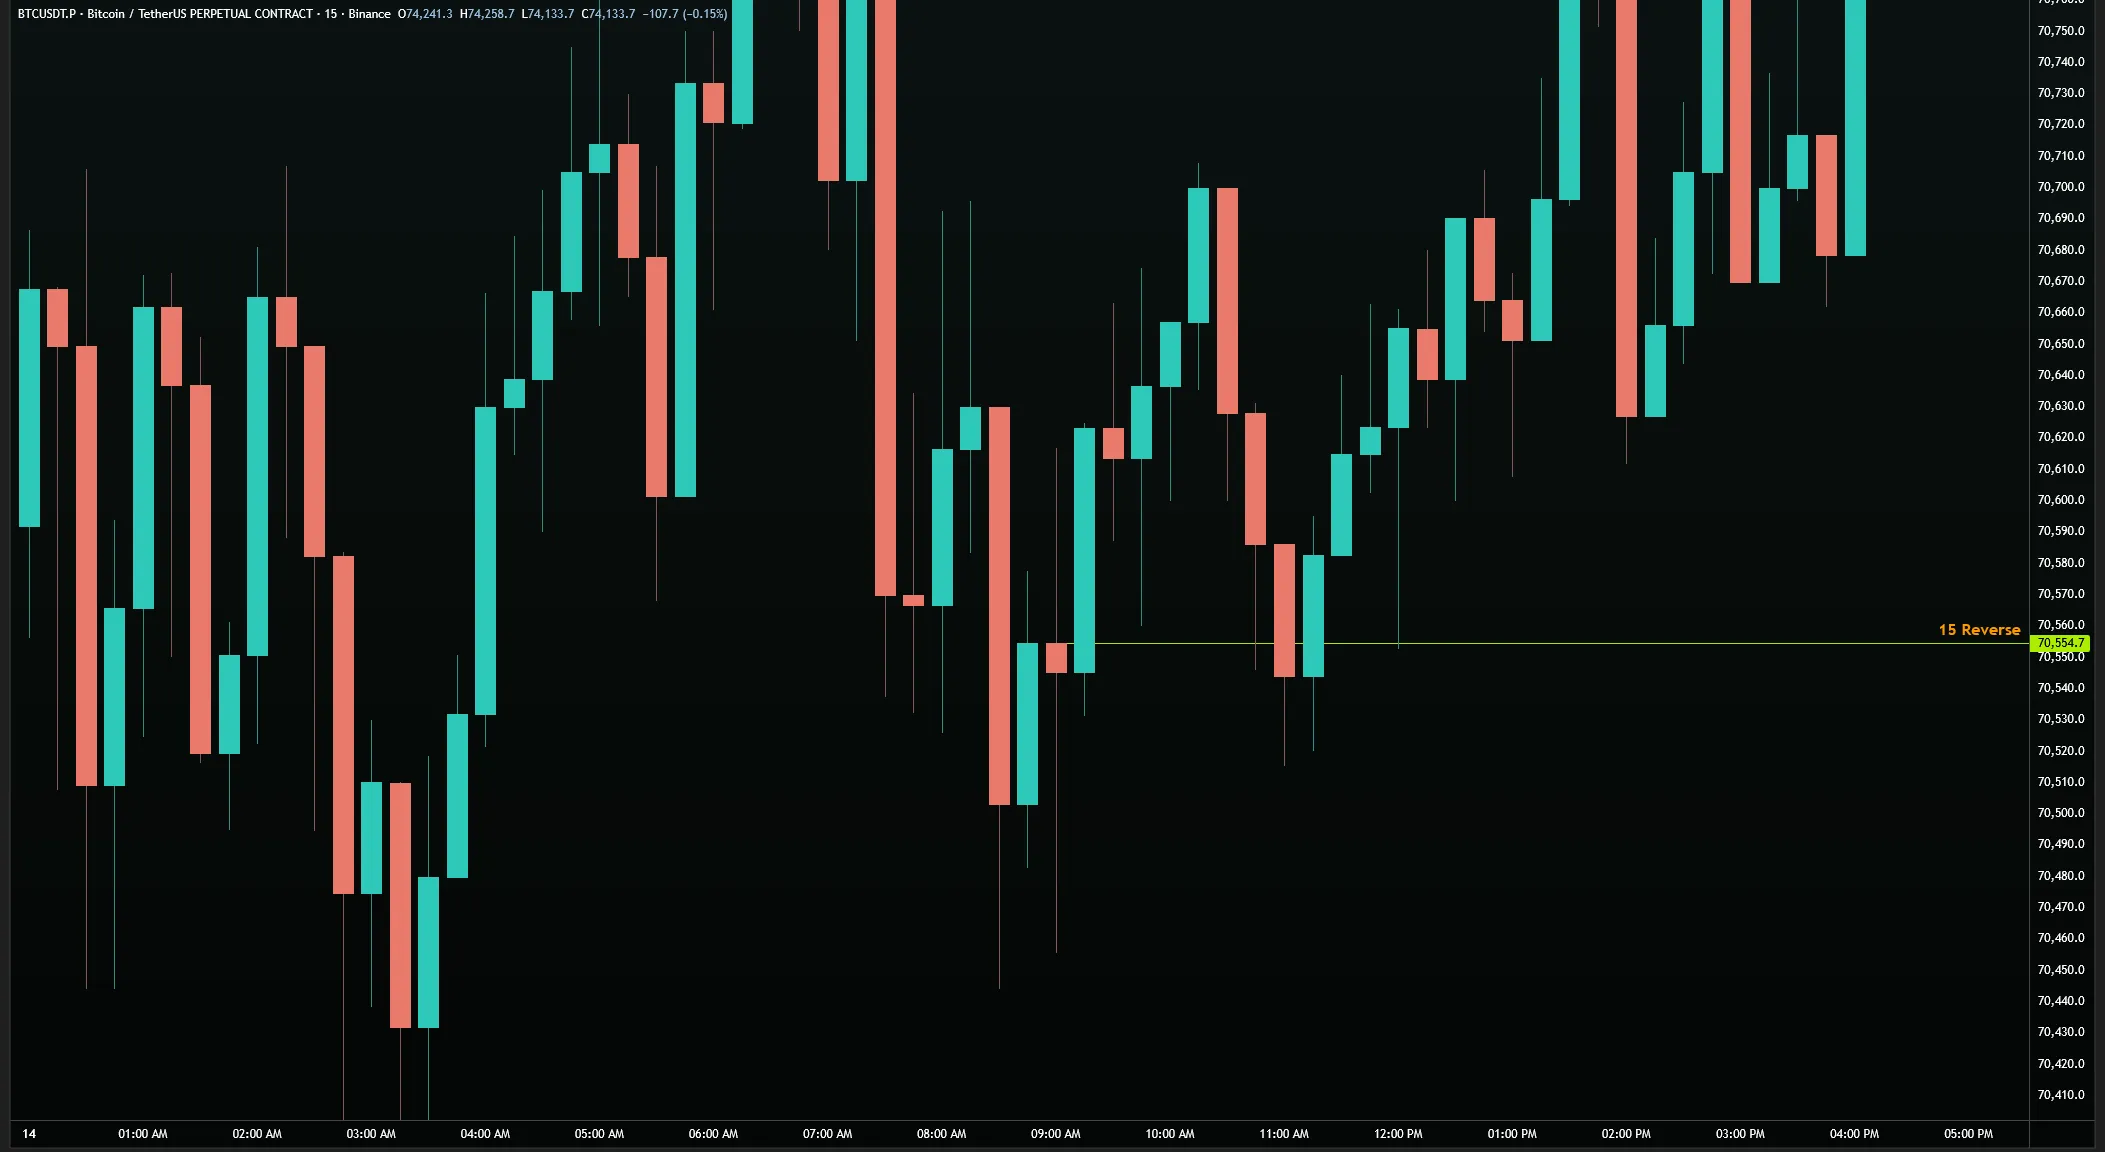
Reverse levels pair naturally with range trends. When a Hold Level is tested multiple times and achieves Reverse Level status, the diagonal line connecting those test points often qualifies as a range trend. The combination of a Reverse Level (horizontal polarity) and a range trend (diagonal polarity) at the same price zone creates one of the strongest structural signals in the science — polarity confirmed by both horizontal and diagonal tests simultaneously.
The plus-one property applies to Reverse Levels exactly as it does to origin levels. A one-hour Reverse Level that has been tested twice becomes a four-hour level. The trades associated with it should be managed at the four-hour timeframe, using four-hour Hold Levels as the controller. The smaller-timeframe source of the Reverse Level does not define how you trade it once it has gained polarity — the elevated timeframe does.
In practice, Reverse Levels appear frequently as back-test targets after significant moves. When price makes a large directional move, the original Reverse Levels from before the move begin are often the first targets for back-testing. The original Hold Levels from the bottom of a large rally, once the rally concludes and reverses, become the first structural targets for price to find on the way down. They are the ghosts of the original structure that started the move, still present on the chart, waiting for the back-test.
Stacking multiple theories: a Reverse Level that is also a plus-one (because it has been tested twice), that is also a RAT (because it has not been tested from the opposite direction since the move began), that is also connected to a range trend — represents an exceptional trade location. Each additional property that a level carries increases the structural weight of its test. The goal in high-accuracy trading is to find these stacked-property levels and trade specifically at those points.
20 - Triggers and shields
The job of a Trigger and Shield is to secure profits and lower risk. You're going to continuously have to work with Triggers & Shields to understand how to use them properly across all scenarios.
- A Trigger is a spot we mark on the charts that calls our attention to manually exit a trade. We use Triggers when we're in profits to set our stop always in the profits.
- A Shield is the final level that we must hold in order for our trade to still be valid. Stop losses are always placed below Shields.
Triggers & Shields are the logic-based system for managing risk within a trade. A Trigger defines the exit point for a winning trade — the price at which you know the chart has moved against your thesis and it is time to stop out. A Shield defines the exit point for a losing trade — the price at which you can't go under so you must use a stop loss to preserve your capital.
Triggers and Shields exist because every trade, no matter how well-constructed, has a point beyond which its original levels are no longer holding the move. A Trigger is not an arbitrary stop-loss number — it is a specific level that, if crossed, structurally confirms that the trade is failing. Specifically: if the Hold Level that your entry is protecting gets Hard Closed, the chart is telling you it is trying to move in the opposite direction. That is your Trigger, and a warning to get out. This is a mental note you must keep top of mind.
Setting a Trigger is a logical process, not an emotional one. Identify the level that must hold in order to keep moving in the direction of your trade — that if broken, would contradict your trade. Your Trigger is a mental note to alert you to exit your trade before it goes against you. You are not setting a stop loss based on how much you are willing to lose. You are setting a mental alarm based on what the chart would need to say to prove your thesis wrong.
A Trigger should be set under a Break Level, not above it. We do this to understand the question: is the move laddering, or testing a Break Level to further move down? This mental Trigger allows you to understand that it's time to get out of the trade — after it recovers slightly but before the move breaks down completely. You are not waiting to lose money; you are using mental alarms called Triggers to trade smarter.
Shields operate on a trailing logic. As a trade moves in your favor, you progressively tighten the shield toward the trade. The initial shield might be set at break-even — or a slight loss below the entry for a long — ensuring you exit with little to no loss if the trade fails. As price moves higher, the shield moves up to lock in whatever profit has accumulated. The shield should always be set at a level that, if price reaches it, means the trade is failing and it's no longer worth it to be in the trade as the level that was supporting the trade has been lost.
The relationship between Triggers and Shields is the relationship between minimum loss and maximum guaranteed profit. A Trigger defines a mental alarm. A Shield defines a stop loss placed just below the deepest emergency level that could still prove your thesis as correct. Together, they create a bounded risk environment: Triggers put risk top of mind to have active alarms, and Shields ensure you cannot lose your accumulated gains beyond the shield level.
Shields should be placed at logic-defined levels — specifically at the final level that could potentially hold up a trade. We have many decisions in Day Trading, and sometimes we are presented with 5 levels we might want to buy, all within close proximity to each other. In these scenarios our best approach is to ensure the trade by balancing our buy decision towards the lower levels, but not the lowest level as we may never reach that price and may miss our trade. However we can balance that lost % by using the final level as our Shield and placing our stop loss below it to perfectly balance ensuring trades while managing risk deficit. The best of both worlds.
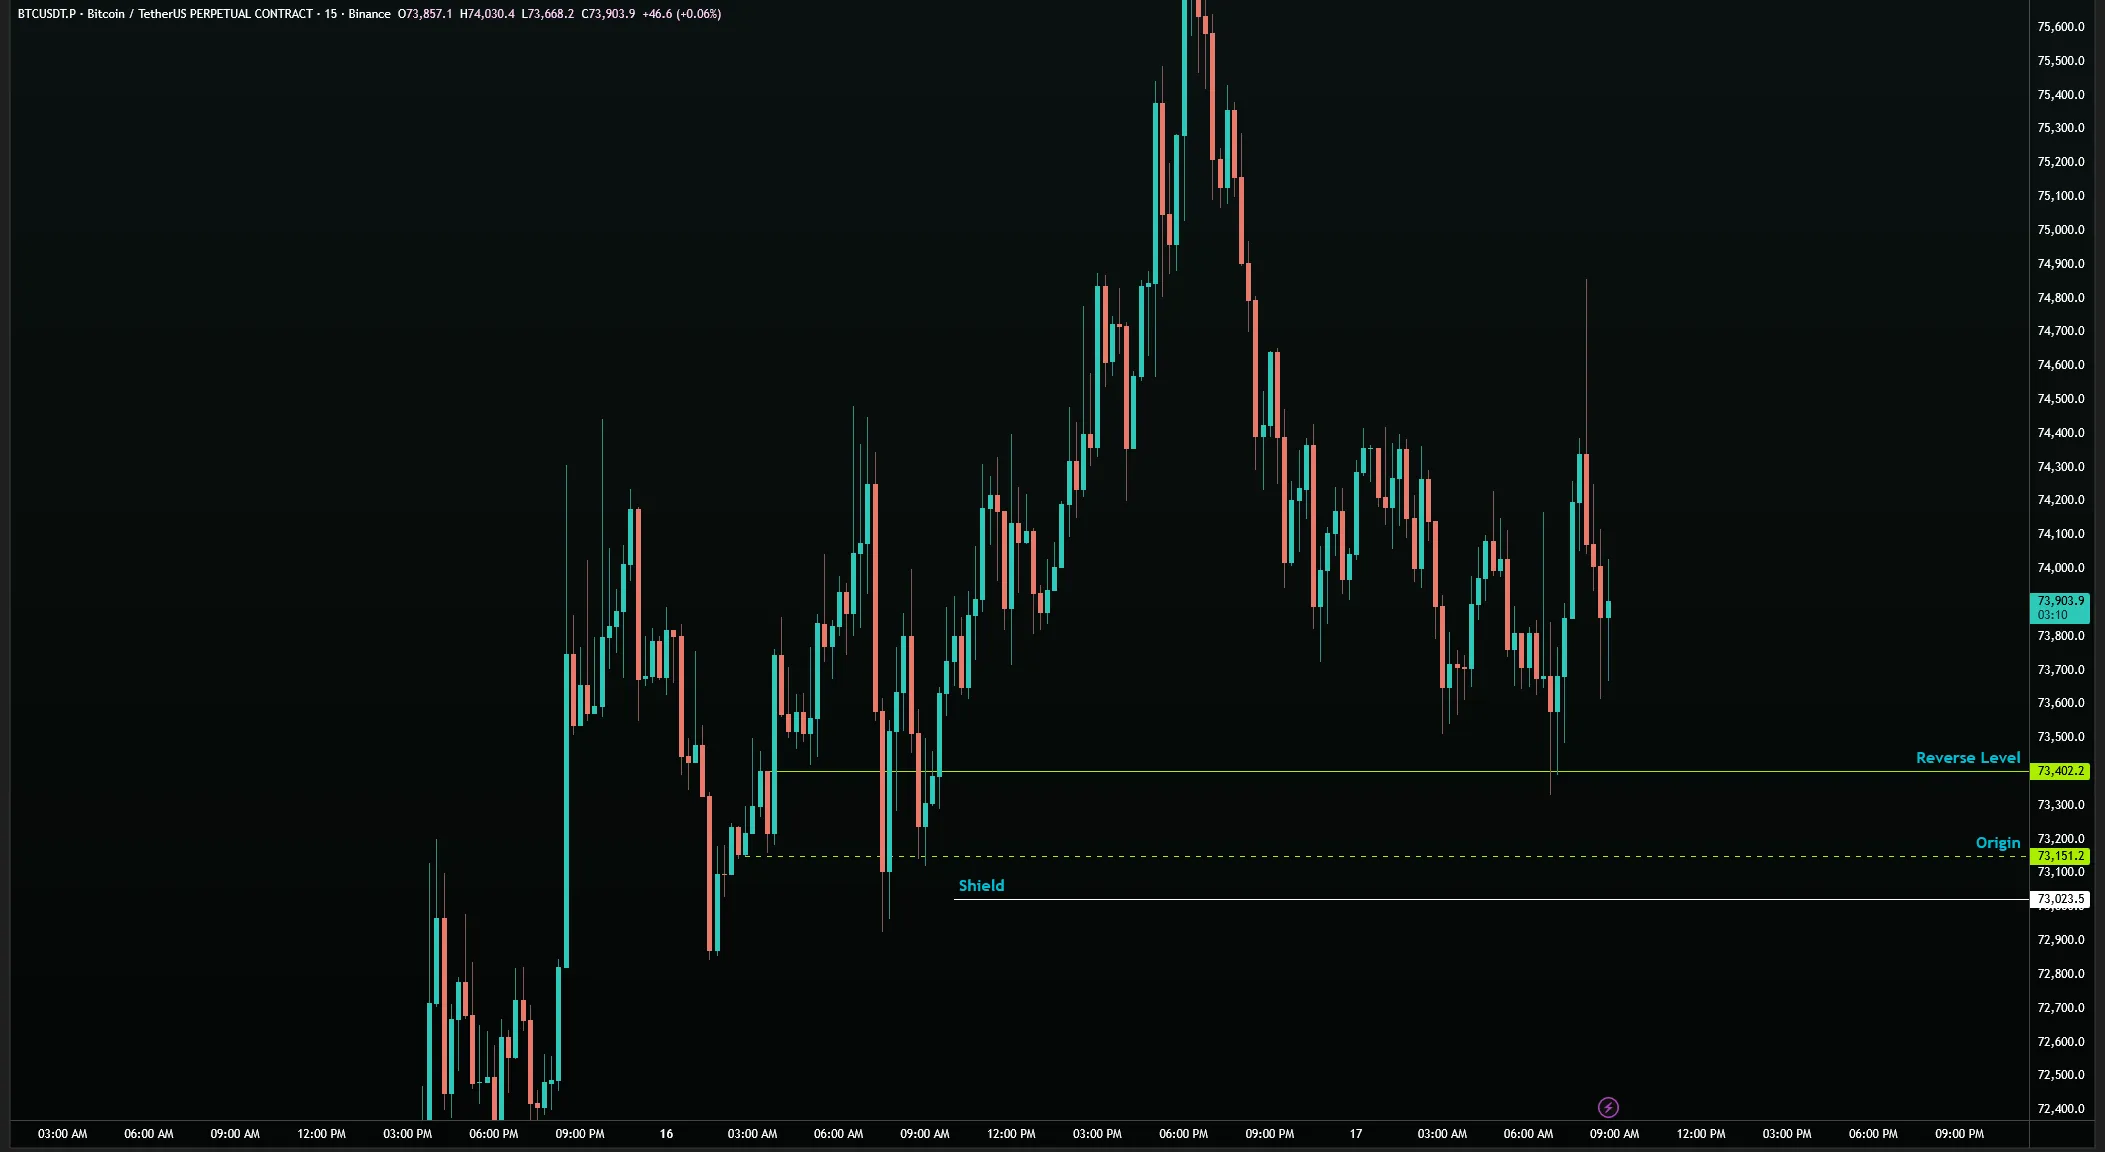
As a trade develops and new timeframe levels are gained, the shield moves up with the move. Each new Hold Level created becomes a potential shield location. The goal is to never allow profits to disappear — once you have gained a timeframe level, that level becomes the floor of your guaranteed exit. The trade continues up, shield following, until the trade's natural target is reached or the shield triggers at a significant profit.
Triggers and shields together represent the professional approach to risk management in this system. They eliminate the two most common errors: (1) staying in a losing trade too long because "it might come back," and (2) exiting a winning trade too early because of fear. Triggers force logical exits on losers. Shields force logical holds on winners. Both are defined by chart structure, not emotion.
21 - Using it all 2
Combining all these theories is the second step towards understanding Technical Analysis. Your success up to this point relies on your ability to realize that charts are simply just data points that can be interpreted to show us truths based on a decycling mathematical system. Our objective is to remove possibilities through data points. The same concept would be removing nodes from a decision tree — when you remove a possibility you reduce total outcomes.
Section Two added thirteen mastery-level tools to the six core pillars of Section One: +1/-1, Combo Levels, Hard Close, Deep Dive, Global Information, Inverse Levels, Ladders, Moveable & Open Trades, Pandora's Box, Polarity, Masters & Controllers, Reverse Levels, and Triggers & Shields. This integration lesson demonstrates how these tools work together — not all at once, but selectively, based on what the chart presents.
The starting framework is identical to the Section One integration: identify what was most recently hit, determine directional context, and work outward from there. The add-ons simply provide more precise answers to questions the core six raise but cannot fully answer on their own. The core six tell you what kind of move is happening. The add-ons tell you with more precision how it will unfold.
The first add-on to apply when approaching any chart is polarity identification. Before placing a single trade, know where all polarized levels are. Identify all Origin Levels (Break Levels tested twice), all Reverse Levels (Hold Levels tested twice), and all trends tested multiple times. Mark the origins and polarity with dashed lines. Color-code them by their elevated timeframe. These are the structural boundaries of everything that happens next.
Everything on the chart — every level, trend, origin, Reverse Level, range trend, RAT, trigger, and shield — is ultimately communicating one of two things: hold or break. This binary code is the foundation. A plus-one communicates "break this timeframe." A minus-one communicates "hold to offset this timeframe." A master says "this is the target." A controller says "this is what breaks or holds the master." All the terminology collapses back to the same underlying message: is this chart breaking or holding its current direction?
When marking Trends, remember that trend direction is defined by the candle color of the starting point. A Trend starting at a Break Level (using the break-level candle's wick as an anchor) represents a trend that is trying to break the move. A Trend starting at a Hold Level (using the Hold Level candle's wick as an anchor) represents a trend that is trying to hold the move. Both types of trends can exist simultaneously on the same chart, representing the two competing pressures at any given moment.
Add-ons should be applied to levels, not to empty space. When you mark an origin level, add the plus-one tag. When you identify a Reverse Level, add the plus-one tag and note the elevated timeframe. When you identify a Pandora's Box between two equal timeframe levels, add the Pandora's Box notation. When you set your entry, add the moveable or open trade tag. Add-ons are annotations that enrich existing structural marks — they are not independent analysis layers.
The cheat sheet serves as the add-on application guide during active charting. Before taking a trade, walk through the add-on list and appl y every relevant one. Does this level have plus-one? Is there combo-level depth that can refine the entry? Has polarity been verified? Are masters and controllers labeled? Is a Pandora's Box state active? Are triggers and shields set? Each relevant add-on checked off is a layer of precision added to the trade.
Not every add-on applies to every trade. Trying to force all sixteen into every analysis is the equivalent of using every tool in a toolbox for every job. The skill that Section Two builds is not knowing all sixteen add-ons — it is knowing which ones apply to the current situation. A simple Hold Level with a clear RAT entry and an obvious untested Break Level as the target may only need three or four add-ons. Applying unnecessary add-ons to a clean setup creates noise, not precision.
The final point of this integration lesson: accuracy compounds. Each correctly applied add-on that confirms the trade thesis increases its probability. Three add-ons all pointing to the same conclusion is better than one. A single wrong add-on — an incorrectly identified polarity, a missed hard close, a miscounted Combo Level — can corrupt the entire chain of reasoning downstream. Accuracy at each step is not about being thorough; it is about being correct. The precision of this system scales directly with the precision of its inputs.
22 - Mental and physical barriers
Mental Analysis is the section of this course that nobody wants to talk about but everybody needs. The science on these charts is only as good as the person applying it. You can know every level, every rule, every theory — and still blow your account because of what happens between your ears. This lesson is my attempt to merge what I've learned trading over many years with what modern psychology actually says about performance, decision-making, and emotional regulation. Take it seriously. The chart doesn't care how smart you are. It only cares what you do.
- The fastest way to convert revenge trading, fear, and overtrading into productive energy is mechanical drilling. When the emotional urge to act hits, redirect it: mark a level, find the combo, identify the origin. Give the emotional brain something precise to do. This is not suppression — it is redirection. The emotion becomes fuel for the science.
- Your physical state is part of your trading system. Sleep deprivation, hunger, and stress compound every cognitive bias you already carry. You cannot separate your biology from your decision-making. Treat your body like a trading variable — because it is one.
Daniel Kahneman spent decades demonstrating that the human mind operates in two modes. System 1 is fast, automatic, emotional, and pattern-driven. System 2 is slow, deliberate, logical, and effortful. When you are in a trade and price is moving against you, System 1 is running the show. It is generating fear, urgency, and the overwhelming desire to do something — anything — to make the discomfort stop. System 2, the part of you that knows the levels and trusts the science, requires effort to engage. It gets drowned out by System 1 under stress. Every mental error in trading — revenge trading, early exits, late entries, position sizing blowups — is System 1 overriding System 2. The entire discipline of Mental Analysis is about training System 2 to stay online when it matters most.
The most documented cognitive bias in trading is loss aversion. Kahneman and Tversky proved that the psychological pain of a loss is roughly twice as powerful as the pleasure of an equivalent gain. This means that by default, your brain is wired to hold losing trades too long (to avoid the pain of realizing the loss) and cut winning trades too early (to lock in the relief of a confirmed gain). These are the exact opposite of what good trading requires. Recognizing this bias does not eliminate it — but it changes your relationship to it. When you feel the urge to hold a loser "just a little longer," that is loss aversion speaking. Name it. Then ask: what does the chart say?
FOMO — the fear of missing out — is the retail trader's most destructive companion. It shows up as chasing moves already underway, accepting bad entries because price is moving fast, and overriding your planned levels because "this one looks different." The psychology behind FOMO is rooted in social comparison and scarcity thinking: someone else is getting rich right now, and if I don't act immediately, I will miss my chance. Both beliefs are distortions. In a mathematical, cyclical science, there is always another setup. The trader who waits for their level and misses a move loses nothing. The trader who chases and gets in wrong has now taken a bad trade, which generates emotional residue that will corrupt the next decision. The cost of FOMO is not just the bad trade — it is the cascading effect on everything that follows.
Define your risk parameters before opening any position. Know your Trigger (the mental alarm level), your Shield (the stop loss), and your primary target before the trade is live. If any of these three are undefined when you enter, you are not trading — you are gambling. A real trade has all three defined in advance by chart logic, not by how the moment feels.
Revenge trading is overtrading's more dangerous cousin. It emerges from a specific psychological sequence: loss → threat to ego → urgency to restore equilibrium → impulsive re-entry. Sports psychology calls this "the hot hand fallacy in reverse" — the belief that because you lost, you are "owed" a win, and that the next trade will be the one that balances the ledger. Markets owe you nothing. The chart does not know you took a loss five minutes ago. What the chart knows is the level, the break, the hold, the wick. If you are entering a trade to recover money rather than because the chart presents a valid setup, you are in revenge mode. The antidote is structural: define a maximum daily loss limit before you trade. When it is hit, the session ends. No exceptions. This is not weakness — it is the most disciplined move available to you.
Carol Dweck's research on mindset is directly applicable here. A fixed mindset interprets a losing trade as evidence of inadequacy: "I'm bad at this." A growth mindset interprets the same event as information: "What did the chart tell me that I didn't use correctly?" The difference in long-term performance between these two orientations is enormous. Every trader in this course will take losses. The question is what happens next. Fixed mindset traders compound losses through emotional escalation. Growth mindset traders compound wins through systematic review. Post-session documentation is not optional for growth mindset traders — it is the mechanism by which learning converts into edge.
Csikszentmihalyi's concept of flow — the state of complete absorption in a task — describes what trading feels like when everything is aligned. You are not fighting your emotions because you are fully engaged with the problem at hand. Flow states in trading are preceded by adequate preparation, clear rules, and the right balance of challenge and skill. When the task is too easy, boredom breeds impulsive behavior. When the task exceeds your current skill, anxiety overrides logic. The sweet spot — where the science is understood but the chart still presents genuine challenge — is where performance is highest and emotional interference is lowest. You cannot will yourself into flow. But you can create the conditions for it: preparation, rest, a clear plan, and genuine engagement with the levels rather than the money.
Confirmation bias is the tendency to seek, interpret, and remember information that confirms what you already believe. In trading, this is the bias that turns a legitimate level into a narrative. You decide the chart is going up, and suddenly every piece of data — the green candles, the Hold Level holding, the Break Level not yet tested — confirms your thesis. The red candles, the failing ladder, the Break Level that was already tested twice without resolution — these get filtered out or rationalized. The science in this course is specifically designed to counteract confirmation bias: every level is binary (tested or not tested), every outcome is structurally defined, and the analytical process follows a fixed protocol. The discipline of Logic Flow is not just an analytical framework — it is a bias-interrupt. Following the twelve steps forces engagement with all the data, not just the data that confirms the trade you want to take.
Self-compassion research by Kristin Neff has consistently shown that self-criticism after failure produces worse subsequent performance than self-compassion — not because self-compassion lowers standards, but because self-criticism consumes cognitive resources that could be used for learning. When you blow a trade due to an emotional error, the most productive response is not shame or self-punishment. It is honest acknowledgment — "I entered before my level because I was afraid of missing the move" — followed by a specific correction — "Next time I wait for the level regardless of how fast the move is." This is the difference between generalizing failure ("I'm always emotional") and localizing it ("I made this specific error in this specific context"). Localized failures are fixable. Generalized failures feel permanent.
The physical dimension of mental performance is not a soft topic. Sleep restriction degrades the prefrontal cortex — the part of the brain responsible for impulse control, risk assessment, and long-term thinking — while amplifying the amygdala's threat response. A sleep-deprived trader is neurologically a different person than a rested one: more reactive, more risk-seeking, more susceptible to every bias listed above. The same applies to blood sugar dysregulation, dehydration, and chronic stress. These are not excuses or reasons to avoid trading — they are variables to manage. Professional performance in any domain treats the body as part of the system. Day trading is no different. If you would not trade on a broken computer, do not trade on a broken body.
The practical summary is this: know your biases (loss aversion, FOMO, confirmation bias, hot-hand fallacy). Know your System 1 triggers (fast price movement, recent loss, social comparison). Have a structural response to each: pre-defined levels, pre-defined exits, mechanical drills as a redirect for emotional urgency, a daily loss limit as a hard stop on revenge trading, and post-session documentation as the learning loop that makes all of it compound over time. The science is the edge. The mental practice is what lets you use it consistently.
23 - Covering trading topics
Every industry accumulates its own vocabulary. Trading has accumulated more than most — and a large portion of it is designed, consciously or not, to sound more scientific than it is. This lesson is about separating the signal from the noise: understanding what the industry says, why people repeat it, and why almost none of it changes what you should actually do on the chart.
- When you encounter a concept that sounds complex and authoritative, ask one question: does this change where I mark a level? If the answer is no, it is context — useful for conversation, not for analysis. The chart does not care what you call what is happening on it.
- Risk management is the one framework from standard industry practice that maps directly onto this science. Define a monthly goal, a weekly target, a daily limit, and a per-trade maximum loss. When the daily limit is hit, the session ends. This is not discipline — it is structure. Structure removes the decision from the emotional moment.
Robert Cialdini's work on social influence identified a cognitive shortcut he called "social proof" — the tendency to assume that if many people are doing or saying something, it must be correct. Trading Twitter, financial media, and retail education platforms operate almost entirely on social proof. Terms like "liquidity grab," "smart money," "order flow," and "institutional manipulation" are repeated so frequently that they acquire the texture of established fact. The psychological mechanism here is important: the more authoritative and mysterious a concept sounds, and the more people around you use it, the more your brain accepts it without demanding evidence. You are not examining the concept — you are inheriting the consensus. The antidote is first-principles thinking: go back to what you can actually observe on the chart and ask whether this concept changes what you mark.
Technical analysis as the industry defines it — price action, chart patterns, Fibonacci retracements, candlestick patterns — is a collection of visual pattern recognition tools built on historical repetition rather than structural logic. Pattern recognition is useful. It builds intuition. But intuition is not the same as analysis. Nassim Taleb described the "narrative fallacy" — the human tendency to construct plausible-sounding stories around sequences of events and then mistake the story for the explanation. Chart patterns are narrative: "this is a double top, therefore price will reverse." The structural science in this course does not use narratives. It uses binaries: is the level tested or not? Is the Break Level cleared or not? There is no "this looks like" in this system. There is only what the data says.
Volume is perhaps the most misused concept in retail trading. It is treated as a leading indicator — a signal of what is about to happen. In practice, volume is a lagging amplifier. It accelerates what is already structurally set up. A Break Level that gets tested with high volume breaks faster than one tested with low volume. But the level still needs to be there. Volume does not create levels. It does not override structure. High volume on a chart with no clear structural level does not tell you anything actionable. The question is always: what level is being interacted with? Volume tells you how fast, not what or where.
Volatility is a concept that deserves particular scrutiny. In academic finance it has a precise definition: the statistical dispersion of returns. In retail trading it is almost always used to mean "price moved a lot and I don't know why." Every large move in a market has a structural explanation. There is a Break Level being cleared, a Polarity point being violated, a master level being hard-closed. When you say "the market is volatile," you are describing your own analytical state — not the market's. Attributing price movement to an external force (volatility, manipulation, algorithms) is what psychologists call the fundamental attribution error: explaining events through context when the real cause is something more specific and findable. Find the level. The explanation is there.
The "liquidity grab" and "institutional order flow" frameworks that dominate retail trading education are particularly worth examining. These frameworks explain price behavior by reference to an invisible, all-powerful actor moving the market against retail traders. The appeal is psychological: it externalizes failure. If a trade loses, it was not a bad analysis — it was the institutions hunting your stop. This reasoning is unfalsifiable and therefore unimprovable. If your trade loses within a structural framework, you can identify exactly what went wrong and correct it. If your trade loses because "the institutions grabbed liquidity," there is nothing to fix. The structural approach is harder and more demanding — and that is precisely why it compounds into skill over time.
Bull and bear market labels are the macro-level version of the same problem. They create anchoring bias — the tendency to over-weight the first piece of information encountered when making a decision. If you begin your analysis knowing "we are in a bull market," every subsequent data point gets filtered through that lens. Upward moves confirm the bull thesis. Downward moves get classified as temporary corrections. The label is working as a prior that biases the posterior. The science in this course is frame-agnostic: a Hold Level on a four-hour chart performs identically in a bull market, a bear market, and a sideways market. The Break Level does not know what the macro label is. Neither should your analysis.
Risk management is the one area where standard industry practice and this science align completely. The nested structure — monthly goal, weekly target, daily limit, per-trade maximum — is a direct application of constraint-based decision architecture. Behavioral economists have shown repeatedly that people make better decisions under clearly defined constraints than in open-ended environments. A trader with no daily loss limit faces an open-ended decision every time they take a loss: should I stop? Should I try to recover? Is this the trade that turns it around? A trader with a daily loss limit does not face that decision. The limit was set in advance, before any emotional state was involved, and it simply triggers. This is not about willpower. It is about removing the decision from the moment when willpower is most compromised.
The practical takeaway from this lesson is a mental filter you apply to every piece of industry content you encounter: does this change where I mark a level, or does it just change what I call what I see? If it does not change the marking, it belongs in the vocabulary category — useful for communicating with other traders, not for executing analysis. If it does change the marking, examine it carefully against the structural logic of this system. The chart is mathematical. The market is not conspiring against you. The levels are findable. The science works. Your job is to apply it clearly, without narrative layered on top of it.
24 - Key Trading terms
Language shapes perception. The vocabulary you use to describe what you see on a chart determines how you think about what it means. This lesson is about building a precise, lean vocabulary — one that maps directly to structural events and strips away words that create confusion, false urgency, or misplaced certainty.
- The working vocabulary of this science: Hold Levels, Break Levels, Origin Levels, Reverse Levels, Polarity, +1/-1, Combo Levels, RATs, Pandora's Box, Masters & Controllers, Triggers & Shields. These are content. Everything else in the industry vocabulary is context.
- Leverage is not a trading strategy — it is a position-sizing variable. Calibrate it so that if your trigger fires, your maximum loss equals your pre-defined daily risk limit. Not your pain threshold. Your pre-defined limit.
Ludwig Wittgenstein wrote that the limits of your language are the limits of your world. In trading, this is not philosophy — it is a practical problem. The words you reach for when you observe price behavior determine what you look for next. A trader who describes a large move as "volatility" is done with the question: the cause has been labeled and filed. A trader who describes the same move as "a Polarity level breaking" is just beginning: now they need to find the level, identify the next target, and determine what the break means for the range. The vocabulary you use either opens the analysis or closes it.
Precision in language also protects you from manipulation — including self-manipulation. James Clear, in his work on identity and behavior, observed that the language you use to describe your identity shapes your actions. "I am a disciplined trader" produces different behavior than "I am trying to be disciplined." When you describe your trades using precise structural language — "I entered at the Combo Level with a trigger at the Break Level and a target at the RAT" — you have committed to a specific thesis with specific conditions. When those conditions are violated, you exit. There is no ambiguity in the language, so there is no ambiguity in the action.
The industry term "stop-loss" carries a psychological weight that the structural term "Trigger" does not. A stop-loss sounds like a loss — your brain hears it as a failure state, something to avoid and delay. A Trigger is a mechanism — a pre-programmed response to a specific structural event. Similarly, "take-profit" activates the regret mechanism: what if I'm leaving more on the table? A Shield is a boundary you defined before the trade opened, based on where the structure says the trade is no longer valid. These are not just different words. They are different mental models that produce different behavior under pressure.
Terms like "liquidity," "volatility," "market sentiment," and "order flow" are not wrong to know — they are parallel frameworks that describe price behavior through different lenses. This science describes the same behavior through structural levels and tested conditions. Knowing the industry vocabulary prevents confusion when you encounter it externally. In active analysis, return to the structural framework. The structural question is specific and answerable. The sentiment question is often neither.
Leverage is perhaps the most psychologically loaded concept in retail trading. Daniel Kahneman's research on "narrow framing" explains the core problem: when losses are large and fast, the brain stops thinking in terms of strategy and starts thinking in terms of immediate pain relief. The decision to close a leveraged losing trade before the trigger fires is almost always driven by the visceral urgency of watching a large number decrease rapidly. Calibrating leverage so that your maximum loss at your trigger equals your pre-defined daily limit solves this structurally: it makes the worst possible outcome tolerable before the trade opens, which means you can hold to your trigger without the emotional system overriding the analytical one.
The bid-ask spread is operationally significant in ways that receive too little attention in retail education. In liquid markets, the spread is negligible. In lower-volume markets, or during high-impact events when spreads widen dramatically, the spread represents a hidden cost that changes real entry and exit prices. This problem has been masked in the industry and buried behind countless strategically placed expansions from business operators.
The most important vocabulary lesson in this course is about the relationship between language and clarity. Every time you find yourself reaching for a vague word — "the market feels heavy," "price is acting weird," "something looks off" — you are describing an analytical gap. You have observed something but cannot yet name it structurally. That gap is an invitation: chase the structure beneath the feeling. What level is nearby? Has it been tested? Is a Break Level being approached from the wrong side? Is a Pandora's Box forming? The vague word points to where your analysis needs to go next. The structural vocabulary is the map. Use it to find your way there.
25 - Stop climbing cliffs
The title of this lesson is a metaphor. Climbing a cliff without proper gear is technically possible. Some people make it. Most don't. And the ones who do often don't know exactly why they succeeded — which means they can't reliably repeat it. This lesson is about replacing the cliff with a staircase: building the internal infrastructure that makes consistent performance structural rather than accidental.
- Each session should begin with a plan and end with a review. The plan defines entries, exits, and risk parameters before the session opens. The review identifies — specifically and without generalization — what was executed correctly and what wasn't. Patterns in the review point to skills to rebuild. One-off errors don't require systemic changes. Systematic errors do. Documentation is how you tell the difference.
- The external environment — other traders' positions, social media performance, community chat during active sessions — is interference, not information. The moment another trader's position influences your entry or exit, you've mixed their variables into your analysis. The result can't be fully trusted because it's no longer fully yours.
Carol Dweck spent three decades studying what separates people who improve from people who plateau. Her conclusion wasn't about talent or natural aptitude — it was about the story people tell themselves about those things. A fixed mindset says: "I'm either good at this or I'm not, and failure confirms I'm not." A growth mindset says: "My current ability is a starting point, not a ceiling, and failure is information about where to work." In trading, fixed mindset thinking sounds like: "I always mess up the entry" or "I'm just not cut out for this." Growth mindset thinking sounds like: "I've misidentified this 15-minute level three times this week — that specific skill needs drilling." The first is a verdict. The second is a work order. You can act on a work order.
One of the most persistent self-defeating patterns in developing traders is the self-serving attribution bias. Wins get attributed to skill. Losses get attributed to external factors — the market was weird, the news spiked it, the algorithm hunted the stop. This attribution pattern feels protective in the short term because it preserves self-esteem. But it is catastrophically expensive long-term, because you can only improve what you are willing to own. If every loss belongs to an external force, there is never a skill gap to close — and the same errors repeat indefinitely. The most valuable habit you can build in this discipline is asking: "What structural information did I have that I didn't use, or what structural information did I misread?" That question only works if you're willing to hold the loss as yours.
Kristin Neff's research on self-compassion produced a counterintuitive finding: people who treat themselves harshly after failure don't perform better — they perform worse. The mechanism is straightforward. Self-criticism after a bad trade consumes prefrontal cortex resources that could be used for learning. It also triggers the same threat-response as external danger — elevated cortisol, narrowed attention, impaired risk assessment. The trader who finishes a losing session berating themselves is not preparing for better performance tomorrow. They are arriving at tomorrow's session carrying yesterday's cortisol load. Self-compassion is not the absence of accountability. It is a different kind of accountability — one that identifies the specific error precisely, then returns to baseline so that learning can actually occur.
How you talk to yourself about your trading is the operating system that runs every other skill in this course. Albert Bandura's work on self-efficacy showed that belief in your ability to execute a specific task is both domain-specific and trainable. You don't need global confidence. You need specific confidence at each skill level: "I can identify a Hold Level correctly." "I can find a Combo Level chain." "I can mark an Origin Level the moment it forms." Each skill drilled to fluency builds a specific self-efficacy deposit. Those deposits compound. Over time they produce a generalized belief that you can navigate a chart — because you've demonstrated it, repeatedly, at each individual skill level. You don't build confidence by thinking about trading. You build it by doing the work until the work becomes automatic.
Each session should begin with a plan and end with a review. The plan defines entries, exits, and risk parameters before the session opens. The review identifies specifically — without generalization — what was executed correctly and what was not. Patterns in the review point to specific skills to rebuild. One-off errors do not require systemic changes. Systematic errors do. The only way to distinguish between them is through honest, consistent post-session documentation.
The comparison trap is one of the most reliable destroyers of developing trader confidence. Social media exists to show you the best outcome from everyone else's session simultaneously. Nobody posts their stop-outs. Nobody shows the three hours of choppy indecision before the clean setup appeared. The visual field is saturated with highlight-reel performance, and your brain — which evolved to benchmark against peers — uses that as the baseline. Leon Festinger's social comparison theory explains how this produces either complacency or discouragement, and in trading it almost always produces discouragement, because the comparison pool is systematically filtered for wins. The correct comparison is you versus your documented performance from three months ago. That is the only benchmark that is both accurate and actionable.
Physical state is cognitive state. Matthew Walker's sleep research established that moderate sleep deprivation — six hours instead of eight — produces measurable deficits in prefrontal cortex function, impulse control, emotional regulation, and risk assessment. These are not abstract capabilities. They are the specific faculties required to follow a structured analytical process, hold a trigger discipline, and resist emotional override during a losing trade. Trading on insufficient sleep is not trading with a slight disadvantage. It is trading with a neurologically different brain — one that is more impulsive, less risk-aware, and more susceptible to every error this course has described. The physical preparation for a trading session is not separate from the trading. It is part of it.
The lesson title — Stop Climbing Cliffs — is ultimately about method. Cliffs attract people who want to skip the stairs. The stairs take longer. They require consistency, documentation, drilling, review, rest, and a willingness to own both wins and losses precisely. But stairs compound. Every step taken correctly makes the next step easier. Every skill drilled to fluency removes a variable that used to be decided by guesswork. Every post-session review converts a repeated error into a closed gap. The science in this course is the staircase. Your internal practice is what determines whether you use it correctly — or whether you keep looking for a shortcut up the cliff.
26 - Logic flow 1-4
Logic Flow introduces the Mastery of Technical Analysis. By understanding Technical Analysis in its entirety you are moving into the highest level use cases which are called Logic Flow.
Logic Flow is the most advanced section of the course. It is the decision architecture that combines all prior learning — Technical Analysis and Mental Analysis — into a structured sequence for approaching any chart. Logic Flow is organized as a twelve-step process divided into three groups of four: Steps 1–4 (exterior analysis), Steps 5–8 (interior analysis), and Steps 9–12 (trade execution). This lesson covers Steps 1–4.
Steps 1–4 are called the exterior range definition. Their purpose is to establish the outermost boundaries of the trade — the highest-timeframe levels that define the top and bottom of the current global range. Everything in later steps will operate within the structure defined by Steps 1–4. If the boundaries are wrong, every subsequent step is off. Steps 1–4 are therefore non-negotiable and must be completed without shortcutting before anything else begins.
Steps 1–4 have a strict no-feedback-loop rule. A feedback loop in this context means going back up in timeframe after having stepped down. If you identify your exterior levels, create your range, find your ladder points, and then realize you need to step back up to a higher timeframe because you missed something, you must restart from Step 1. This forces the habit of complete higher-timeframe analysis before moving into smaller timeframes. Feedback loops in Steps 1–4 indicate that the exterior work was not done properly the first time.
Step 1: Identify the exterior levels that are being hit. These are the highest-timeframe levels relevant to the current move. Start at the weekly or daily timeframe. Identify the Hold Levels and Break Levels at the top and bottom of the current global range. If you are looking at a chart where the weekly level is being tested, mark those weekly levels. If the active levels are at the four-hour timeframe, mark those. The goal is to identify the most significant level being tested at the highest timeframe currently active.
Step 2: Create the range. Using the exterior levels identified in Step 1, define the boundaries of the current range. The range defined is the box to operate within. The range top is defined by the relevant break or Hold Levels at the top of the move. The range bottom is defined by the relevant levels at the bottom. The range must be drawn before any interior analysis begins — it is the context container for everything that follows.
Step 3: Find the ladder points. Within the defined range, identify all levels that represent the wicks of the current ladder — the progressive levels that price has been creating as the move advances. Ladder points define the sub-ranges inside the larger range, and if the larger move is willing to hold. They show you where the Nested Elements are and what intermediate targets must be processed before the exterior targets are reached.
Step 4: Identify the masters and controllers. Given the exterior levels and range defined in Steps 1–3, determine which timeframe is the master (the highest-timeframe polarized level defining the range boundary) and which is the controller (one timeframe below the master, which will determine whether the master breaks or holds). Labeling the master and controller creates the timeframe context that all interior work in Steps 5–8 will operate within. You now know which timeframe levels to watch and which to ignore.
Steps 1–4 are a quality control gate. If they are done correctly, the entire subsequent analysis has a solid structural foundation. If they are done carelessly — if the wrong timeframe is used as the master, if the range is drawn too loosely, if a critical ladder point is missed — the errors compound through every subsequent step. The discipline to complete Steps 1–4 fully and correctly, and to restart if a feedback loop occurs, is what separates consistent analysis from chaotic charting.
27 - Logic flow 5-8
Logic Flow is a skill that you will be refining daily for the entirety of your trading career. It is the highest level of logic output to gain accuracy there is. Every section in 1–12 carries imperative guidance. Master all 3.
Steps 5–8 cover the interior range. Having defined the exterior structure in Steps 1–4, the job now shifts to understanding what is happening inside the range — which levels are active on the interior, which polarity points are present, and what the internal timeframe hierarchy looks like. Unlike Steps 1–4, Steps 5–8 actively encourage feedback loops. Going back and forth between timeframes during interior analysis is the correct process, not an error.
Step 5: Mark all origin levels (Break Levels tested twice) visible on the interior timeframes. Origins are the first thing to mark in the interior because they define where polarity exists inside the range. An origin on the one-hour timeframe divides the interior into two zones. An origin on the 15-minute adds a finer division within those zones. Marking all origins gives you the polarity map of the interior, which tells you which directional expectations apply to each sub-zone.
Step 6: Mark the interior levels. Having identified polarity through origins, now mark all the Hold Levels, Break Levels, Reverse Levels, and range trends that exist on the interior timeframes. These are the structural furniture of the range — the levels that price will interact with as it moves within the range. Do not try to predict which ones will be hit. Mark all of them, then let the subsequent steps filter out the irrelevant ones.
Step 7: Verify timeframes — also called level adaptation. Verification means going back through all levels marked in Steps 5 and 6 and confirming that each one is on the correct timeframe, correctly labeled, and consistent with the master-controller hierarchy defined in Step 4. Verification means going down to lower timeframes to confirm a level is untested, going up to confirm the timeframe assignment is accurate, and adjusting any level that was misidentified. This iterative back-and-forth is the defining characteristic of Steps 5–8.
During Steps 5–8, feedback looping — returning to higher timeframes to check and correct your work — is not just allowed, it is required. The interior range is complex. You will mark levels on the 15-minute, go to the five-minute to verify, find they are already tested, adjust, return to the 15-minute, find a new level, verify at the three-minute, and so on. This iterative back-and-forth process is how interior accuracy is achieved. The prohibition on feedback loops only applies to Steps 1–4.
Step 8: Identify the specific levels that will be used for trade entries. After marking all interior levels and verifying their timeframes, identify which of the marked levels represent valid entry candidates for the trade direction you have determined. These should be specific levels — specific Hold Levels, specific Break Level tests, specific RAT locations — that are untested, correctly timeframed, and consistent with the master-controller direction. Not all levels in the interior are trade entries. Step 8 is the filtering step.
The output of Steps 5–8 is a chart that is fully populated with verified interior levels, has its polarity points marked, has its timeframes confirmed, and has specific trade entries identified. This chart now has everything needed to move into Steps 9–12, where actual trade placement occurs. No trade should be placed before Steps 5–8 are complete — doing so is the equivalent of building a house without a foundation plan.
The most common mistake in Steps 5–8 is over-marking. When going through interior levels iteratively, it is easy to accumulate every level visible on every timeframe, resulting in a chart so cluttered that no clear signal is visible. The skill of Steps 5–8 is not marking everything — it is marking what is structurally relevant and systematically removing what is not. Level removal is a continuous process throughout the interior analysis, not a final cleanup step at the end.
28 - Logic flow 9-12
The mastery of Logic Flow is a must before you move onto the next pillar of trading — Comparative Analysis. There's a natural connection that flows from Logic Flow into Comparative Analysis, just as there's a natural relationship flow between Technical Analysis and Logic Flow.
Steps 9–12 are where the trade is actually placed. Having completed the exterior analysis (Steps 1–4) and the interior analysis (Steps 5–8), you now have a fully prepared chart with verified levels, identified polarity, confirmed timeframes, and specific entry candidates. Steps 9–12 convert that preparation into an executed trade.
Step 9: Pick shorts and longs. Identify the specific direction of the trade you intend to take. Direction is not a gut-call decision — it is the product of all prior steps. The master-controller hierarchy indicates which direction has structural support. The interior polarity map shows which side of the range is structurally stronger. The untested levels identified in Step 8 indicate where the best entries exist. Step 9 is the moment you commit to direction based on all of this structural evidence.
Step 10: Remove irrelevant levels. After committing to a direction, go through your chart and remove all levels that do not apply to the trade you are about to take. Levels on the opposite side of the interior range, levels that have already been tested and are no longer active, and levels that are too far from current price to be relevant to the current move should all be cleared. The goal is a clean chart — one where every level visible is directly relevant to the trade being made.
The criminal offense of Logic Flow: picking a trade entry and then immediately jumping to identify targets. This approach skips Steps 1 through 11 entirely. The correct sequence is: define exterior range → interior polarity → interior levels → entry candidates → direction → remove irrelevant levels → set orders → set triggers and shields → identify target. The target is Step 12. It is the last step, not the first. Anyone who identifies their target before completing the prior 11 steps is trading on hope, not logic.
Step 11: Place orders. Set the actual entry price for the trade. Entry is typically at one of the specific levels identified in Step 8 — the untested, timeframe-verified interior levels that represent the best entry points for the chosen direction. If Combo Levels were identified during interior analysis, the entry is at the deepest valid Combo Level. If a RAT was identified, the entry is at the RAT location. The entry should match the level with the most structural support for the thesis.
Step 12: Identify the target. Now — and only now — determine where the trade is going. The target is defined by the first significant untested level in the direction of the trade that the analysis supports. It is the next origin level, the next RAT, the next master-level boundary in the direction of the move. The target is not a round number or a wishful guess — it is the nearest structurally-defined level in the direction the master-controller analysis says price is moving.
Set Triggers and Shields as part of Steps 11–12. The Trigger is set at the Break Level that, if tested, would contradict the trade thesis. The initial Shield is set just below your final emergency level that can hold your trade. As the trade progresses and new Hold Levels are created, Shields are moved up progressively to lock in profits. The trade is managed from this point forward using the Trigger-and-Shield framework from Section Two.
Logic Flow 1–12 is a protocol, not a rigid procedure. At any point, new information from the chart may require revisiting a prior step. A new candle closing that hard-closes a level changes the landscape — an interior level that was active is now removed, and the analysis adjusts. Adapting is not a failure of the process. It is the process working as intended: updating based on new structural information as it arrives. The discipline is updating the analysis without abandoning the structural framework.
29 - Step 1-4 Walkthrough
Steps 1–4 of Logic Flow have one purpose: build the outermost bounding box. Before any interior analysis begins, you must define the outer range boundaries — the levels that tell you where the move can go, where it creates a Pandora's Box, and where it breaks. Everything you do in 5–12 is downstream of getting this right. This walkthrough demonstrates the decision logic behind Steps 1–4 in real time, including why certain levels are included, why others are discarded, and how the three-outcome framework — move up, Pandora's Box, move down — simplifies every structural decision.
The purpose of Logic Flow Steps 1–4 is not to find every level on the chart. It is to find the minimum viable architecture — the outermost bounding box that tells you what can happen next. By limiting scope to the exterior range first, you eliminate the feedback loop problem that plagues most chart sessions. You are not jumping between timeframes and levels trying to build a complete picture. You are building the frame, and only the frame, before you fill in the interior.
When approaching Steps 1–4, the question is always the same: what is the outermost level that defines the current range? Start with the highest timeframe relevant to the current position — and ask one thing about each level: has it been tested or not? If a level has already been tested twice, it is a Reverse Level and carries elevated structural weight. If it has been tested once, if it's deep dove it is a candidate for a reverse in the future. If it is untested, it is the target. Levels that have already been tested perfectly and are no longer structurally relevant get removed. You are building the smallest number of levels that tell the largest possible structural story.
Every range you define in Steps 1–4 resolves into two possibilities. The first: price gains the RAT and the Hold Level above holds — this moves price up. The second: price cannot gain the RAT — this breaks the move immediately downward. Before you build any interior analysis, these two localized outcomes should be identifiable from your Steps 1–4 markup. If they are not clearly readable from your chart, the exterior work is incomplete.
The most common mistake in Steps 1–4 is doing too much. If you are going back and forth between levels, you have entered a feedback loop. Steps 1–4 operate exclusively at the weekly, daily, four-hour, and in some occasions the hourly timeframes. Interior timeframes belong to Steps 5–8. The exterior frame must be complete before the interior analysis begins — not partially built, not concurrent.
One nuance that only appears in certain range configurations: the RAT that blocks the range from even reaching its worst-case scenario. In most ranges, the three outcomes — up, Pandora's Box, down — cover the full decision tree. But when a significant untested level sits inside the range and below the Pandora's Box level, failing to gain that level means the chart does not even reach the Pandora's Box outcome. It collapses immediately. This fourth condition — inability to gain the interior RAT — is not a regular feature of every range, but when it is present, it is the most structurally significant of the four outcomes. It tells you that the chart's structural permission to even attempt a move upward is already in question.
The time cost of Steps 1–4 matters. If you are spending two hours marking levels across every timeframe before a session begins, that time has a cost — it depletes mental energy, inflates analysis complexity, and creates the false sense of preparation without trading. The goal of Steps 1–4 is not thoroughness. It is speed and clarity. A clean exterior frame — built in minutes, not hours — gives you a focused session with a clear decision tree. Everything that does not contribute to the three-outcome framework of the exterior range is a distraction that belongs in a different step, if it belongs at all.
The Ladders within Steps 1–4 define the sub-boundaries inside the exterior range. Each Ladder point represents a structural wick — a level that either continues the move or, if lost, immediately shifts the structural expectation downward. When you identify the Ladder points inside the exterior range during Steps 1–4, you are pre-loading the question that Steps 5–8 will answer in detail: which of these interior levels defines the next meaningful target? Steps 1–4 plant those flags. Steps 5–8 evaluate them. The integrity of the entire Logic Flow sequence depends on not blurring that boundary.
Targets are last. Finding where the trade can go is Step 12 — the final step. During Steps 1–4, you are not calculating upside. You are not estimating how far price could travel. Those calculations are noise at the exterior analysis stage, because they are entirely contingent on the two-outcome resolution of the range. If the chart cannot gain a level, there is no target to find. Build the frame. Identify the outcomes. Let the chart resolve. Targets follow from that resolution — they are never the starting point.
30 - Step 7 Walkthrough
Like, what exactly am I doing here in this scenario? So that's where you really want to say, like I can go back and forth feedback myself with Logic Flow to see where my combos are, where my Trails are, what my outcomes can be. We know the hourly is Polarized, so we can't be hitting that hourly. We we technically could.
Again, we technically could go all the way up here, hit this and it's Ladder, Ladder Ladder. But I think that's more indicative of creating a Pandora's box, because then we need to understand the next piece of that, which was what breaks it down. What creates a Pandora's box? Oops. What creates a Pandora's box and what breaks it up?
Yeah. Yeah for sure I get that completely. So five through eight like just as a quick overlook on 5 to 8, five through eight is about understanding what's happening in the interior parts of the chart. So one through four is about defining that Nested Element at the highest level. And then five through rate is starting to understand what is happening on the interior parts of the charts.
Step 7 of Logic Flow — Verify Timeframes — deserves individual examination because it is where the most errors accumulate and where the quality of the entire analysis is most vulnerable. Verifying timeframes means going back through every level marked in Steps 5 and 6 and confirming that each one is correctly timeframed, correctly labeled, and consistent with the structural context of the range. This process is iterative, not linear — it requires moving back and forth between timeframes until all levels are confirmed.
The core activity of Step 7 is comparing what you have marked with what is actually on the chart. You marked a level as a one-hour Break Level. Go to the one-hour chart and confirm that it is indeed a Break Level at the one-hour scale, that it has not been tested already, and that its position makes structural sense within the one-hour context. If any of these checks fail, the level is adjusted or removed. This checking process is applied to every level on the chart.
One common Step 7 discovery: a level that was marked on the 15-minute chart is actually a one-hour level — meaning it is a 15-minute origin (tested twice at the 15-minute scale), making it a one-hour structural level due to plus-one. The 15-minute label was technically accurate at creation but the structural implication is one-hour. Step 7 is where this kind of reclassification happens — not because the original marking was wrong, but because the add-on context changes the operational timeframe.
Feedback loops in Step 7 are correct procedure. Going from the 15-minute to the one-hour to verify a level, then back to the 15-minute to find a new level, then to the five-minute to verify that new level, then back to the one-hour to check consistency — this is exactly what Step 7 looks like. The iteration is not a problem to be minimized; it is the mechanism by which accuracy is built. Stop only when all levels are verified and consistent.
Level adaptation — the adjustment of a level's position or timeframe label — happens continuously during Step 7. When a level is found to be already tested on a lower timeframe, it is removed or adjusted. When a level is found to represent a higher timeframe than originally marked (due to polarity), its label is updated and its treatment in subsequent steps changes accordingly. The chart after Step 7 should look different from the chart before Step 7 — cleaner, more accurately labeled, and with some levels removed.
Nesting during Step 7 means progressively moving to smaller timeframes within the range to find the innermost structural points. Start from the controller timeframe (from Step 4), work down to the next timeframe, then the next, building a picture of the nested structure inside the range. The goal is to find, within the range, the specific timeframe levels that will stop the move at each sub-range boundary. These are the structural furniture of the interior analysis.
The mental model for Step 7 is a snapshot comparison. At any given moment, you have a mental snapshot of what the chart should look like based on your prior analysis. As you move between timeframes and verify levels, you update that snapshot. When the live chart matches the snapshot — when every visible level is confirmed, timeframed correctly, and consistent — Step 7 is complete. If there are still discrepancies between the snapshot and what the chart is actually showing, verification is not done.
31 - Offsetting
Offsetting is a tool we use to understand where +1/-1 gets applied and the effect it has. All information has three attributes: what breaks it — what equalizes it — what holds it. If you take a 15-minute level for example you can say: using +1/-1 I understand what timeframes are relevant, and if we combine that with Offsetting we get: what breaks it is +1 as the hourly — what equalizes it is the same timeframe as the 15-minute — what holds it is the -1 as a 5-minute. A level deeper would dictate those rules nested inside each other. If a 1-hour level breaks the current move because it's a +1, then a 15-minute can offset that 1-hour level — therefore offsetting that we're breaking the move and reversing it into equalizing or holding. We offset timeframes by adding a second layer of +1/-1 to itself.
Offsetting is the mechanism by which one timeframe level is offset — overridden or supported — by a level one timeframe below or above it. When a smaller-timeframe level holds in opposition of a larger-timeframe level, it offsets the larger timeframe and tells you the move will challenge that larger timeframe. When a larger timeframe level tests from the result of a smaller timeframe holding, it tells you the larger timeframe's expectation is being challenged.
The three outcomes when a level is hit are: a minus-one level holds it (offsetting it downward, meaning the move continues), an equal-timeframe level is hit (creating a Pandora's Box between two equal levels, meaning no clear direction yet), or a plus-one level is hit (a larger timeframe, meaning the move is being attacked at the higher level and the current timeframe is potentially breaking). These three outcomes — offset down, equalize, or offset up — cover every possible scenario when a level is tested.
The specific timeframe relationships in offsetting are fixed by the nine-timeframe system. A 15-minute level hit by a five-minute hold (-1 to 15) tells you the 15-minute move is being offset — continued. A 15-minute level hit by another 15-minute level (equalize) tells you a Pandora's Box exists at the 15-minute. A 15-minute level followed by the hourly being hit (+1 to 15) tells you the hourly level is being attacked by the smaller timeframe and is likely to break.
Offsetting extends fractal into Nested Elements. If a five-minute level is hit after the opposing 15-minute level (offsetting the 15-minute), and then tries to attack that 15-minute level — which was generated by the 5-minute offset — if it then hits a 3-minute level which protects our original 15 from being hit, this stops the 5-minute level attack and puts that 5-minute level in failure. The first 15-minute level is still in success towards its 15-minute — or its +1, the hourly.
A 15-minute level is hit on the top side. The chart has three options: go to a five-minute Hold Level (offset — 15-minute holds), stay at the 15-minute (equalize — Pandora's Box between two 15-minute levels), or go to the one-hour level (plus-one attack — 15-minute is being broken by the hourly). If it goes to the five-minute level and holds, the 15-minute position is maintained and price is expected to continue in the 15-minute direction. If the five-minute is then offset by a three-minute hold, the offset chain is confirmed two levels deep.
When using offsetting to interpret chart behavior, always identify the exact timeframe of each level being hit and compare it to the timeframe expected by the offset logic. If a 15-minute level is being offset, the holding level should be a five-minute — not a four-minute or a seven-minute. The nine-timeframe progression is strict. An incorrect timeframe assignment produces incorrect offset readings.
Offsetting is especially powerful when combined with the Nested Elements framework. Each Nested Element (range-inside-range) has its own offsetting logic operating at the appropriate scale. The large range offsets through its controller timeframe. Inside that, the sub-range offsets through its own controller. When all levels of this nested offsetting system align in the same direction, the move is structurally confirmed at every scale simultaneously — the highest probability configuration in the system.
Practically, offsetting tells you what to watch for in real time. When a level is hit, immediately identify: what is the minus-one to this level? If that minus-one level exists and holds, you have an offset — the current level is being maintained. If it does not hold, price is attacking the larger timeframe. The three-outcome framework (minus-one offset, equalize, plus-one attack) gives you a complete decision tree for every level test you observe.
32 - The importance of RATS
Rejection as Target, as an isolated concept, is straightforward: any Hold Level that you haven't reached yet because you are below it (if the Hold Level is a red candle), or above it (if the Hold Level is a green candle) that has been gained as a Hold Level yet is a RAT. In active trading, RATs serve as the structural checkpoints that verify whether a move has the structural permission to continue and create timeframe Hold Levels. If a RAT is not gained, the move does not have the structural clearance to proceed past it. This makes RATs not just entry tools but directional confirmation tools.
Rejection as Target, as an isolated concept, is straightforward: any Hold Level that you haven't reached yet because you are below it (if the Hold Level is a red candle), or above it (if the Hold Level is a green candle) that has been gained as a Hold Level yet is a RAT. In active trading, RATs serve as the structural checkpoints that verify whether a move has the structural permission to continue and create timeframe Hold Levels. If a RAT is not gained, the move does not have the structural clearance to proceed past it. This makes RATs not just entry tools but directional confirmation tools.
When a significant RAT is being approached, the structural question is always: does the chart have what it needs at the smaller timeframes to actually gain this RAT? If the 15-minute RAT is the next target, and there is a five-minute Hold Level between current price and the RAT that has not been gained, the five-minute Hold Level must be gained first. The sequence is nested: gain the smaller timeframe holds to gain the larger timeframe RAT, and gain the larger timeframe RAT to confirm the next level above it is the new target.
Think of a RAT as buying into a Hold Level before it gets created. The benefit would be you get an even better price than the best entry — as the Hold Level in the future becomes the final point, and you got in before that was even created at a better price.
RATs also provide the precise logic for scaling in and out of trades. When a trade has been entered at a lower level and is progressing toward a significant RAT, the RAT is both the natural target and the natural decision point for whether we will continue moving past it to create a Hold Level, or if we will fail and keep moving in the opposite direction. Gaining the RAT is a confirmation signal. Failing to gain the RAT— approaching it and reversing below it without Hard Closing — is a rejection signal. The RAT's behavior at the moment of testing tells you everything about the move's structural health.
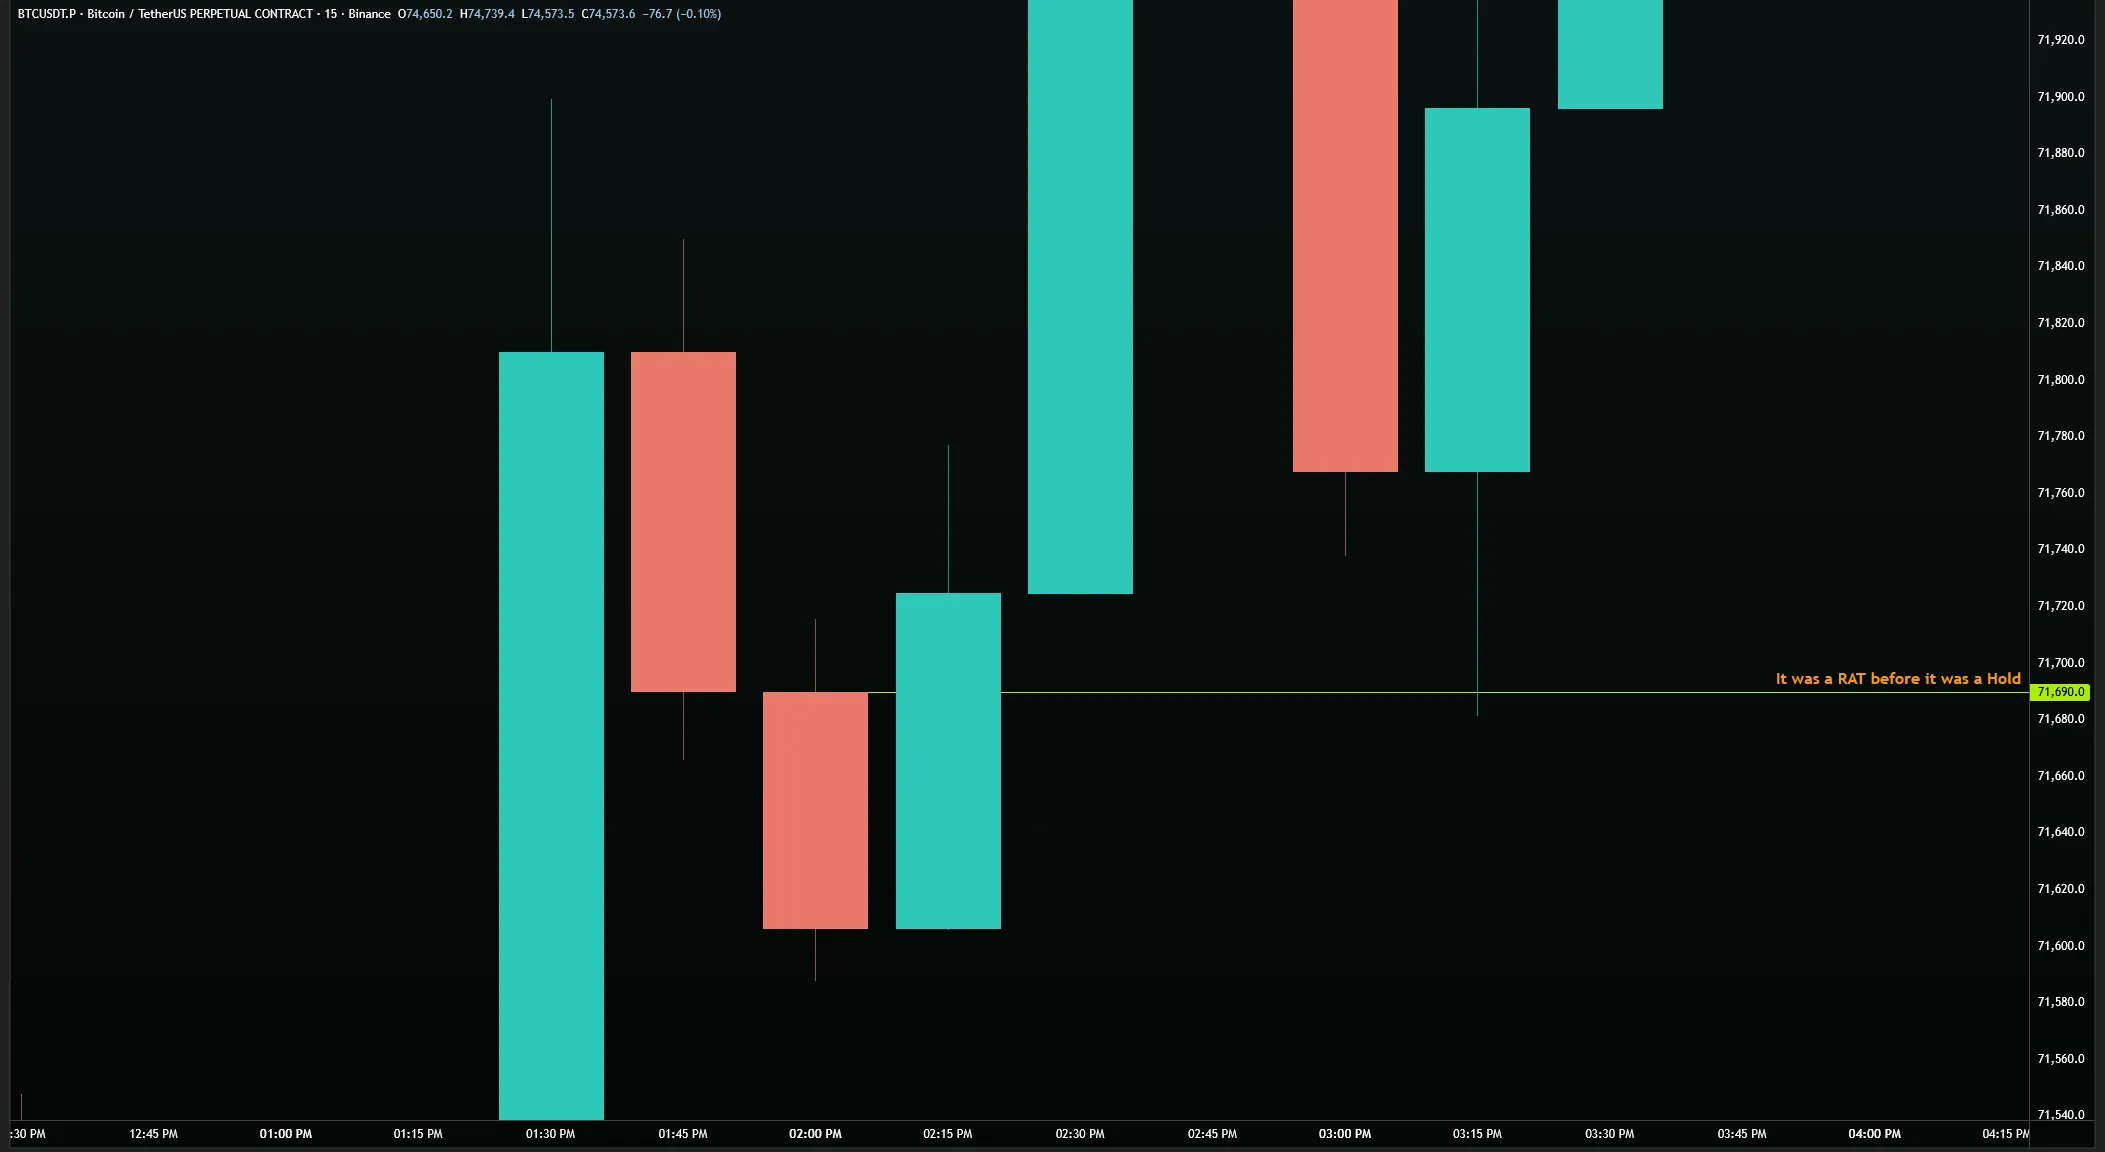
At higher timeframes, RATs are particularly significant because the distance to the next RAT is much larger. A four-hour RAT that has never been tested since the beginning of a major move represents a structural ceiling that has been in place for days or weeks. Gaining that RAT is not just one level test — it is the chart demonstrating that it has assembled enough structural permission at every timeframe below it to break through a major structural ceiling. The significance of a four-hour or daily RAT gain is disproportionately large.
The combination of RATs with the +1/-1 framework provides the highest accuracy RAT analysis. When you identify a RAT at the one-hour level (a one-hour hold that has not been tested from above/below), your -1 to that RAT is the 15-minute timeframe. If a 15-minute Hold Level holds just below the one-hour RAT, it is offsetting the one-hour RAT position and confirming that the one-hour move has structural support. The 15-minute hold holding tells you the one-hour RAT will be maintained — the chart will continue using it as a floor rather than attacking it from above.
When multiple RATs at different timeframes are stacked at nearly the same price, the resulting confluence is one of the most significant structural positions on any chart. A five-minute RAT, 15-minute RAT, and one-hour RAT all within a few ticks of the same price represents a level that has never been tested from above at any scale. Gaining such a level — or losing it from above — produces large moves because the chart is simultaneously processing the structural implications at multiple timeframes all at once.
33 - Nested Elements
A Nested Element is the epitome of seeing targets within targets. Understanding how nesting works connects all Technical Analysis within one Range and uses all layers of knowledge to encapsulate a total picture. Once nesting is understood the entire boundary can be set into a list of hard rules.
Nested Elements is the conceptual framework for understanding that every range contains smaller ranges inside it, which contain even smaller ranges inside them. A range at the weekly timeframe contains four-hour ranges. Each four-hour range contains one-hour ranges. Each one-hour range contains 15-minute ranges. These ranges are nested inside one another like Russian dolls.
The term "Nested Elements" is used to train the visual habit of seeing ranges-within-ranges rather than isolated levels. When you look at a chart, you are not just seeing a collection of levels — you are seeing a structural hierarchy where each level is the boundary of a nested range. The level at the top of the weekly range is the outer shell. The level at the top of the four-hour sub-range is the next shell in. The 15-minute level is the innermost shell currently visible.
Nested elements become most practically important when you are trying to understand what will trigger a move toward the outer shell. A move does not jump from the innermost range to the outermost range in a single step. It must break out of the innermost Nested Element first, then the next, then the next, until it has broken free of all Nested Elements and is targeting the outer range boundary. Each Nested Element break is a precondition for the next.
Identifying Nested Elements begins at the highest timeframe of the current trade context and works inward. Start with the master-controller pair. Identify the master-level range boundary. Then identify the controller-level range boundaries inside that. Then identify the next timeframe down inside those. Map the nested structure until you reach the timeframe where you intend to trade. That innermost range is where your active trade will operate, but all outer ranges define where the eventual targets are.
When an inner Nested Element breaks, the chart targets the corresponding level in the next outer element. If the 15-minute range breaks, the chart targets the next one-hour level. If the one-hour range breaks, the chart targets the next four-hour level. The break of each Nested Element sends price to the next nest out. Understanding this sequential escalation prevents the mistake of setting targets too far ahead — the chart goes through each nest in sequence, not from the innermost to the outermost in a single move.
Nested elements provide the framework for understanding when a move is structurally complete. If all the Nested Elements within a range have been broken in one direction, there is no structural permission within the current range for a reversal. Price must continue toward the outer range boundary because the inner elements that would have stopped it have all been broken. This is the structural equivalent of saying "all holds have been tested and all Break Levels have been hit" — the chart has processed every Nested Element and has nowhere left to go but the outer boundary.
The connection between Nested Elements and Combo Levels is direct. When you cascade down through timeframes to find a Combo Level, you are identifying the innermost Nested Element that is connected to the outer target. The Combo Level is the one-minute expression of a four-hour target — the deepest accessible shell of the four-hour's nested structure. Entering at the Combo Level means you are entering at the innermost Nested Element that is still connected to the outer target, providing maximum precision for minimum risk.
34 - Nested ranges
As to where Nested Elements will tie everything into one binding box, Nested Ranges refer to the application of using nesting to apply practical layers.
Nested Ranges is the operational implementation of Nested Elements. Where Nested Elements describes the theory — ranges inside ranges inside ranges — Nested Ranges is the practice of marking those ranges on a live chart and using them to understand current position and next targets. The shift from "Nested Elements" to "Nested Ranges" is the shift from conceptual understanding to active charting.
To mark Nested Ranges: start by identifying your master level, and build the architecture of the levels that have been hit inside the Combination Levels, and the ones that haven't. We want to see what levels have been tested inside this specific range, so that when the range protecting it loses its level, we can see what will hit inside our Nested Range. For example if we have a 4-hour Hold Level that is untested, and a 1-hour untested Combo Level, that leads into a 15-minute tested Hold Level — this will create a trail.
This 15-minute trail is tethered to the nested 4-hour timeframe. If the 15-minute trail exists, and we move multiple Ranges away, once that 15-minute trail breaks it pulls that level right back to the original 4H nested Range. This often creates large moves in the markets, and combines itself with +1/-1 as the next decision to see if the nested 4H level can hold inside the Nested Range. If the 1-hour Hold Level — that was above the original 15-minute Nested Level — holds, then your 4-hour level is holding, and you're still moving in the same direction as it is confirming its ladder.
Each Nested Range has a top and a bottom defined by the levels on its timeframe. The top of the one-hour nested range is a one-hour break or Hold Level. The bottom is another one-hour break or Hold Level. When price is inside this nested range, it is navigating between these two boundaries. When price breaks one of the boundaries, it exits that nested range and enters the corresponding level of the next outer nest.
The operational value of Nested Ranges is level clarity and range tethering. When you are inside the innermost active range, you know exactly where the targets are at each level of the nest: if you are inside a 1H candle, you see the 15-minute hold is stabilizing, and then you gain a 5-minute RAT and back test it as a Hold Level — you are being shown a 5-minute trail is trying to be created. Once you gain the hourly RAT you'll know to watch for 5-minute levels to become trails as it's tethered to the Range. When you know this, you can set targets with precision — the immediate target is the boundary that's tethered off the current innermost nest; the extended target is the boundary of the next outer nest.
Nested Ranges also clarify which levels to watch and which to ignore at any given moment. If you are inside the one-hour range, the daily levels at the outer nest are not immediately relevant to the current trade. They become relevant when the one-hour range breaks. Knowing which level of the nest is currently active keeps the analysis focused on what matters right now, without distraction from levels that belong to a different, outer context.
Disconnected timeframes break the nested range chain. If there are no one-hour levels within a four-hour range — meaning the one-hour structure has no untested levels between the four-hour boundaries — the nested range at the one-hour level is absent. In that case, you cannot use one-hour Combo Levels to refine entry to the four-hour level, because the one-hour nest does not exist in the connected chain. The entry goes directly to the next connected timeframe that does have valid levels within the range.
As Nested Ranges break one by one in the direction of the move, a trail forms. Each broken range boundary becomes a former resistance (or support) that price will back-test as it moves to the next nest. These back-tests are the moments of highest entry precision — price returns to a recently broken range boundary to confirm the break before continuing. Entering at a confirmed back-test of a broken nested range boundary is a structurally sound, logic-defined entry with clear trigger and shield logic defined by the structure of the range just broken.
35 - When combos meet trails
Combos meeting Trails is when two events collide and work in harmony to create stronger reactions. Combo Levels often support ladder points, and ladder points can sometimes create Trails. I'm always looking for where these two meet — a Combo Level also being supported by a Trail is an extremely strong area.
Combo-trail convergences are most common at the close to Ladder Points. Ladders are typically dictated by deep Combo Level, or Reverse Level tests making them natural spots to have Combos meet Trails. Create a trail of levels during a pullback, and then at the deepest point of the pullback, the Combo Level from the original higher-timeframe structure is found. The convergence of the pullback trail's end with the Combo Level's location is the entry signal. The subsequent move is the completion of the Combo Level and the resumption of the larger trend.
Combination levels and trails are two separate concepts that, when they converge at the same price point, create one of the highest-precision entry configurations in the system. A Combo Level provides depth — the cascade of timeframes pointing to a specific price as the correct entry. A trail provides sequential confirmation — the progressive series of levels that have been hit in sequence to lead price to that precise point. When both point to the same price, the entry confidence is highest.
A trail in this context is the sequence of progressively tested levels leading from a higher timeframe to the current price. If the four-hour level was just tested, and the chart is now creating one-hour levels in sequence toward a specific price, that sequential progression is a trail. It shows that the move is behaving as expected — hitting the levels it should hit in the order it should hit them. The trail confirms the structural integrity of the move.
When a trail terminates at the same price as a Combo Level — when the deepest untested level in the combo chain is also the next level in the trail — you have a convergence. The combo says "this is where the four-hour target ultimately points." The trail says "the chart has been sequentially building toward this point." Together, they say: this specific price is structurally confirmed as the next stopping point from multiple independent structural perspectives.
To identify a combo-trail convergence: first complete the Combo Level analysis (cascade down from the four-hour or daily through one-hour, 15-minute, five-minute, three-minute, one-minute to find the deepest connected untested level). Then map the trail (identify the sequence of levels that have been hit leading up to current price, and project what the next level in the sequence is). If the next trail level matches the deepest Combo Level, you have a convergence.
The entry at a combo-trail convergence requires no prediction. The combo provides the price level to enter at. The trail provides the sequential confirmation that the move is structurally intact. The stop logic is defined by what would break the deepest combo timeframe level. The target is defined by the higher timeframe origin of the combo chain (the four-hour or daily level being targeted). Everything is structurally defined before the trade is placed.
When evaluating whether a combo-trail convergence is valid, verify that the trail has no breaks — no tested levels that should have been untested, no timeframe levels that are disconnected, no points where the sequential progression jumped a timeframe or repeated a timeframe. A trail with breaks is not a valid trail. A combo with disconnections is not a valid combo. Both must be clean and connected for the convergence to carry its full structural weight.
36 - Tested Timeframes
What does it look like when a level gets hit? This is one of the most asked questions I've had in my career, and to answer it once and for all: any level that is hit on any timeframe is a tested level. This isn't to say levels can't be tested twice — it is to simply define what a tested level is. We have nuances such as Reverse Levels, but a level is tested when it's hit on any timeframe.
Tested Timeframes is the discipline of verifying, at lower timeframes, whether a level that appears untested on the higher timeframe has actually been tested at a smaller scale. A level that looks untested on the 15-minute chart may have been touched precisely at the one-minute level, making it technically tested even though the 15-minute candle does not clearly show the test. Without going to the lower timeframes to verify, you can miss these tests entirely.
The core principle: a level is tested the moment price reaches the exact price point, regardless of which timeframe candle is being examined. A one-minute candle reaching the price of a 15-minute level tests that 15-minute level, even if the 15-minute chart shows a candle that does not visually appear to have reached it. The body and wick of a candle on any timeframe — not just the target timeframe — constitutes a test if price reached the level price.
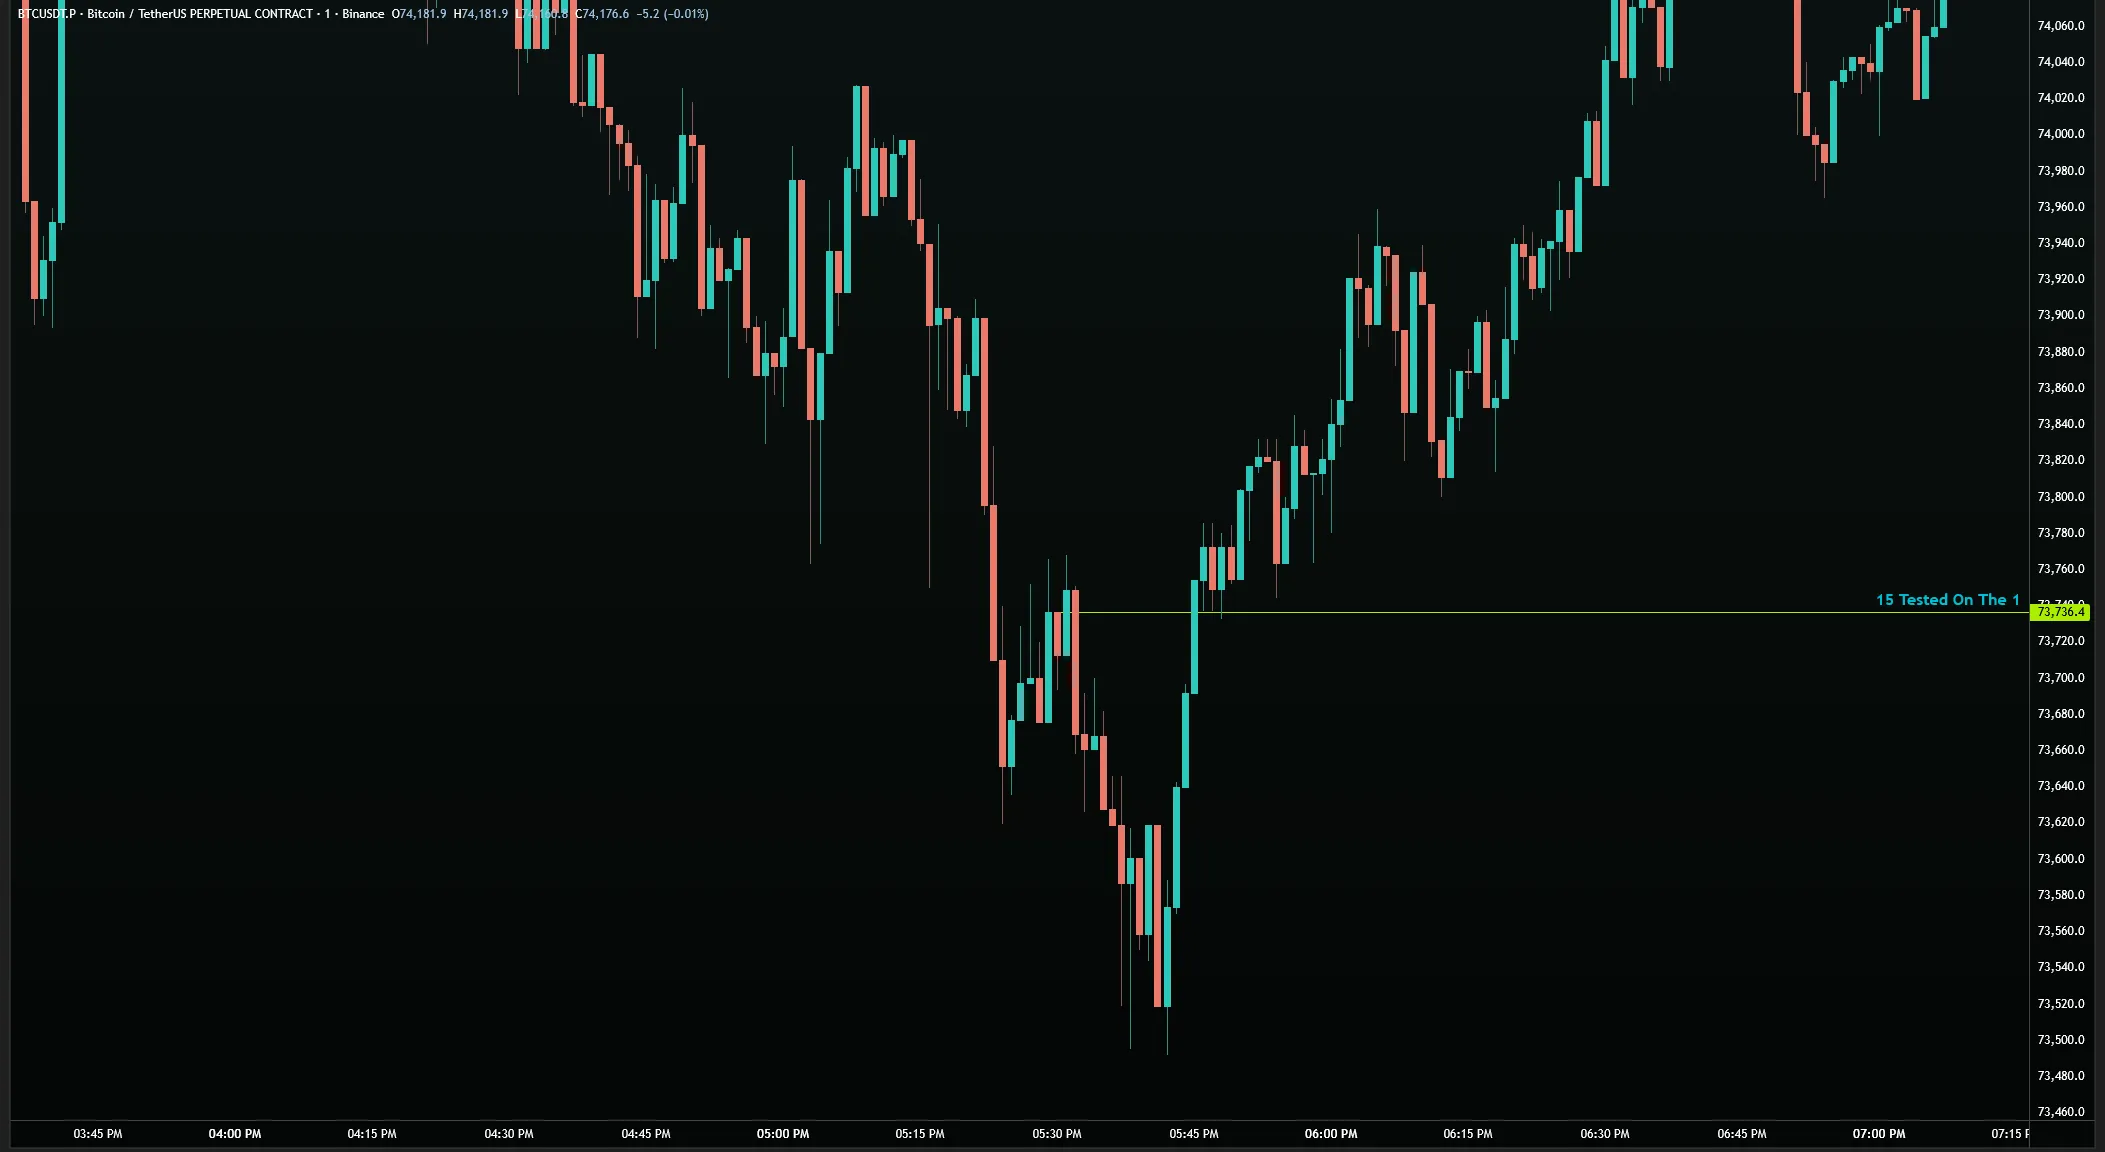
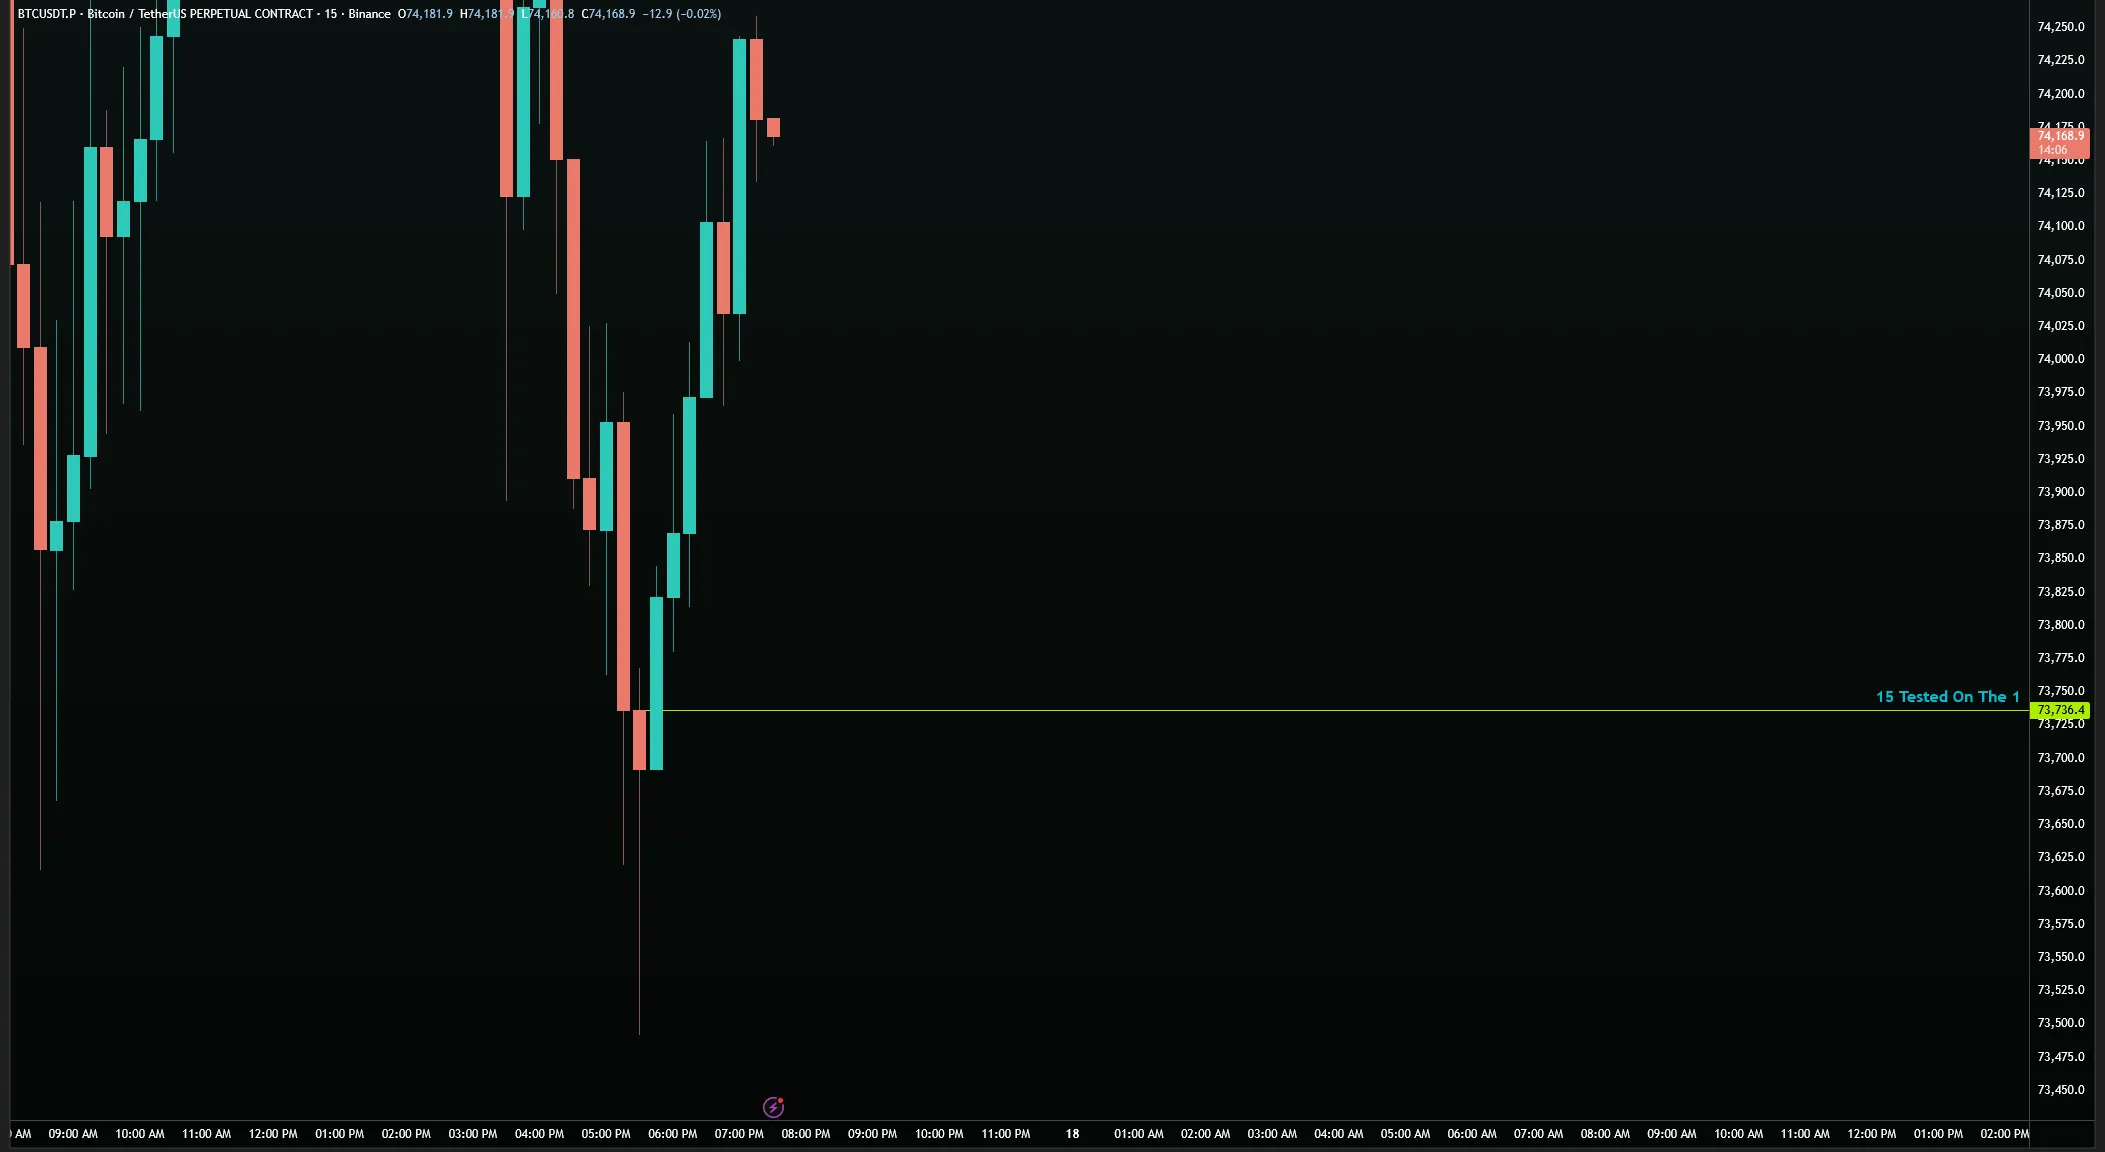
The practical consequence of this is significant. When you have a combo chain — hourly, 15-minute, five-minute, three-minute, one-minute — and you are evaluating which levels in the chain are still valid entry candidates, you must check each level not just at its own timeframe but at the lower timeframes below it. A five-minute level may appear untested on the five-minute chart but may have been precisely hit on the one-minute chart without the five-minute candle clearly showing it.
Before treating any level in a combo chain or trail as the valid entry, go to the lowest available timeframe and check whether it has been tested. If price has touched the level at any timeframe — even the one-minute — the level is tested and should be removed from your list of valid entries. The only valid combo entry is an untested level at every timeframe from its creation down to the one-minute. A level tested at any smaller timeframe is disqualified.
The process for verifying tested timeframes: take the level you are evaluating. Go to the one-minute chart. Look at every candle from the creation of the level to the present. Has the wick or body of any one-minute candle reached the exact price of the level? If yes, the level has been tested. Remove it. If no, the level is genuinely untested and remains a valid entry candidate. This verification can be tedious for older levels that have been sitting on the chart for many hours, but it is essential for accuracy.
Tested timeframe verification is also how you find the final valid entry in a Combo chain. If you have cascaded down through a combo chain and found that the five-minute level has been tested (when checked at the three-minute), you continue down: is the three-minute level untested? Check at the one-minute. Is the one-minute level untested? While the 3-minute and 1-minute levels may be untested they can still be used, just not as Combo Levels. The 15-minute above the tested 5-minute level may be the deepest level in the Combo Level chain that survives this verification process.
Understanding tested timeframes also helps explain why a level that appears precise at higher timeframes sometimes misses at execution. If you are entering a four-hour combo at what you believe is the one-minute level, but that one-minute level was actually tested an hour ago and you missed it, the real level has already been processed. The entry you planned for is gone. The move you were expecting from that level will not materialize because the structural event (the level being reached) already happened. Tested timeframe verification prevents you from entering at a level that has already done its work.
37 - Conditions
Conditions are the bridge between Logic Flow and Comparative Analysis. They start to take the logic layer of charting and meld it with the mental state of being in a live trade — comparing events against each other to generate data live and on the spot. This bridge between these two worlds must exist as all of our conditions are set with logic, yet they are applied at the layer of application known as Comparative Analysis. This lesson serves to make you aware of a mental switch-off point when you enter a trade.
Conditions are specific logical statements — "if X happens, then Y" — that define the criteria under which you stay in a trade, exit a trade, or adjust your analysis. Conditions are applied to the interior logic of an active trade, providing a real-timeframework for decision-making as the trade develops. They are not predictions; they are responses to structural events as they occur.
Conditions are different from triggers and shields. Triggers and shields are exit mechanisms — they define the prices at which you leave the trade. Conditions are analytical checkpoints — they define the structural events that confirm or challenge your trade thesis while you are still in the position. A condition might be: "do not lose this 15-minute Hold Level." That is not an exit price; it is a structural requirement that, if violated, changes the analytical picture.
Well-defined conditions have three properties: they are specific (they reference a specific level at a specific timeframe), they are binary (they are either met or not met — no ambiguity), and they have pre-defined implications (you know in advance what it means if the condition is met or broken). Vague conditions like "the chart should keep going up" are not conditions — they are wishes. A valid condition reads: "the one-hour Hold Level at [price] must hold; if it does not, the Break Level at [price] is now likely to be tested."
Conditions are applied in layers corresponding to the nested range structure. The outermost condition is the master-level requirement: "the master must not be broken from below." The next condition is at the controller level: "the controller Hold Levels must continue to hold." Interior conditions cascade down from there: "the 15-minute Break Level must not be tested," "the five-minute Hold Level must stay above the trail's previous rung," and so on. Each layer of conditions corresponds to a layer of the nested range structure.
When a condition is broken, the analysis does not necessarily end the trade — but it requires the trade to be reassessed. A broken condition means one piece of structural evidence has changed. Assess whether the remaining structure still supports the trade. If two or three conditions break sequentially, the thesis is likely compromised and the trade should be exited using the most recently relevant shield. A single broken condition is information; multiple broken conditions in sequence is a verdict.
Conditions provide the real-time management framework that prevents the two most common active-trade errors: staying in a losing trade too long (by defining the conditions under which the trade is structurally wrong before it becomes financially painful) and exiting a winning trade too early (by defining the conditions under which the trade is still structurally valid, giving you confidence to hold through normal price oscillations that do not actually threaten the thesis).
The practice of defining conditions before entering the trade — not after — is a critical habit. When a trade is live and moving against you, your analytical clarity degrades. Emotions make you want to set conditions that are favorable (confirming the trade) rather than conditions that are structurally accurate (neutral truth). Defining conditions in advance, when you are calm and the analysis is clear, ensures that your real-time management is driven by logic established before emotion had any input.
Comparative analysis — the management layer that operates after a trade is entered — is fundamentally a conditions-based practice. At each step of comparative analysis, you are identifying conditions: what must be true for the trade to proceed, what has changed since entry, and what the new conditions look like given the current structural state. Conditions are the active expression of Logic Flow once you are inside a trade.
38 - Removing levels with +1-1
Removing levels is the most important maintenance task we have on our charts. Visual clutter is enemy #1 in this industry — a cluttered screen not only leads to misplacing trading spots but is a complete distraction from logical charting. Once a week I delete every single level on my chart just so it forces me to re-engage with every range.
Removing levels is an active and continuous process in Logic Flow. The chart that existed before a trade started is not the chart that exists mid-trade. As conditions are met, as levels are tested, as timeframes are gained — the structural picture changes. Levels that were valid entries five minutes ago may now be tested and irrelevant. Levels that were distant targets may now be immediate resistance. Managing this evolution requires systematically removing levels that are no longer active.
The primary trigger for level removal is a test occurring. When a level is tested — body or wick reaching the exact price, confirmed at the lower timeframes — it is removed. Removal on a test is the most straightforward case. A tested level has done its structural work. It either held and created a new structure (in which case the new structure is what matters) or it was broken through (in which case a new level may have been created from the candle that broke it). In either case, the original level is gone from the relevant set.
The second trigger for level removal is when plus-one minus-one analysis reveals that a level is no longer in the structural chain. If the offsetting logic of the current move has moved past a specific timeframe level — if the chart has gained the timeframe that level was supporting — the level below it in the chain no longer has structural relevance to the current move. Remove it. Keeping it creates visual noise that obscures the levels that are actually relevant.
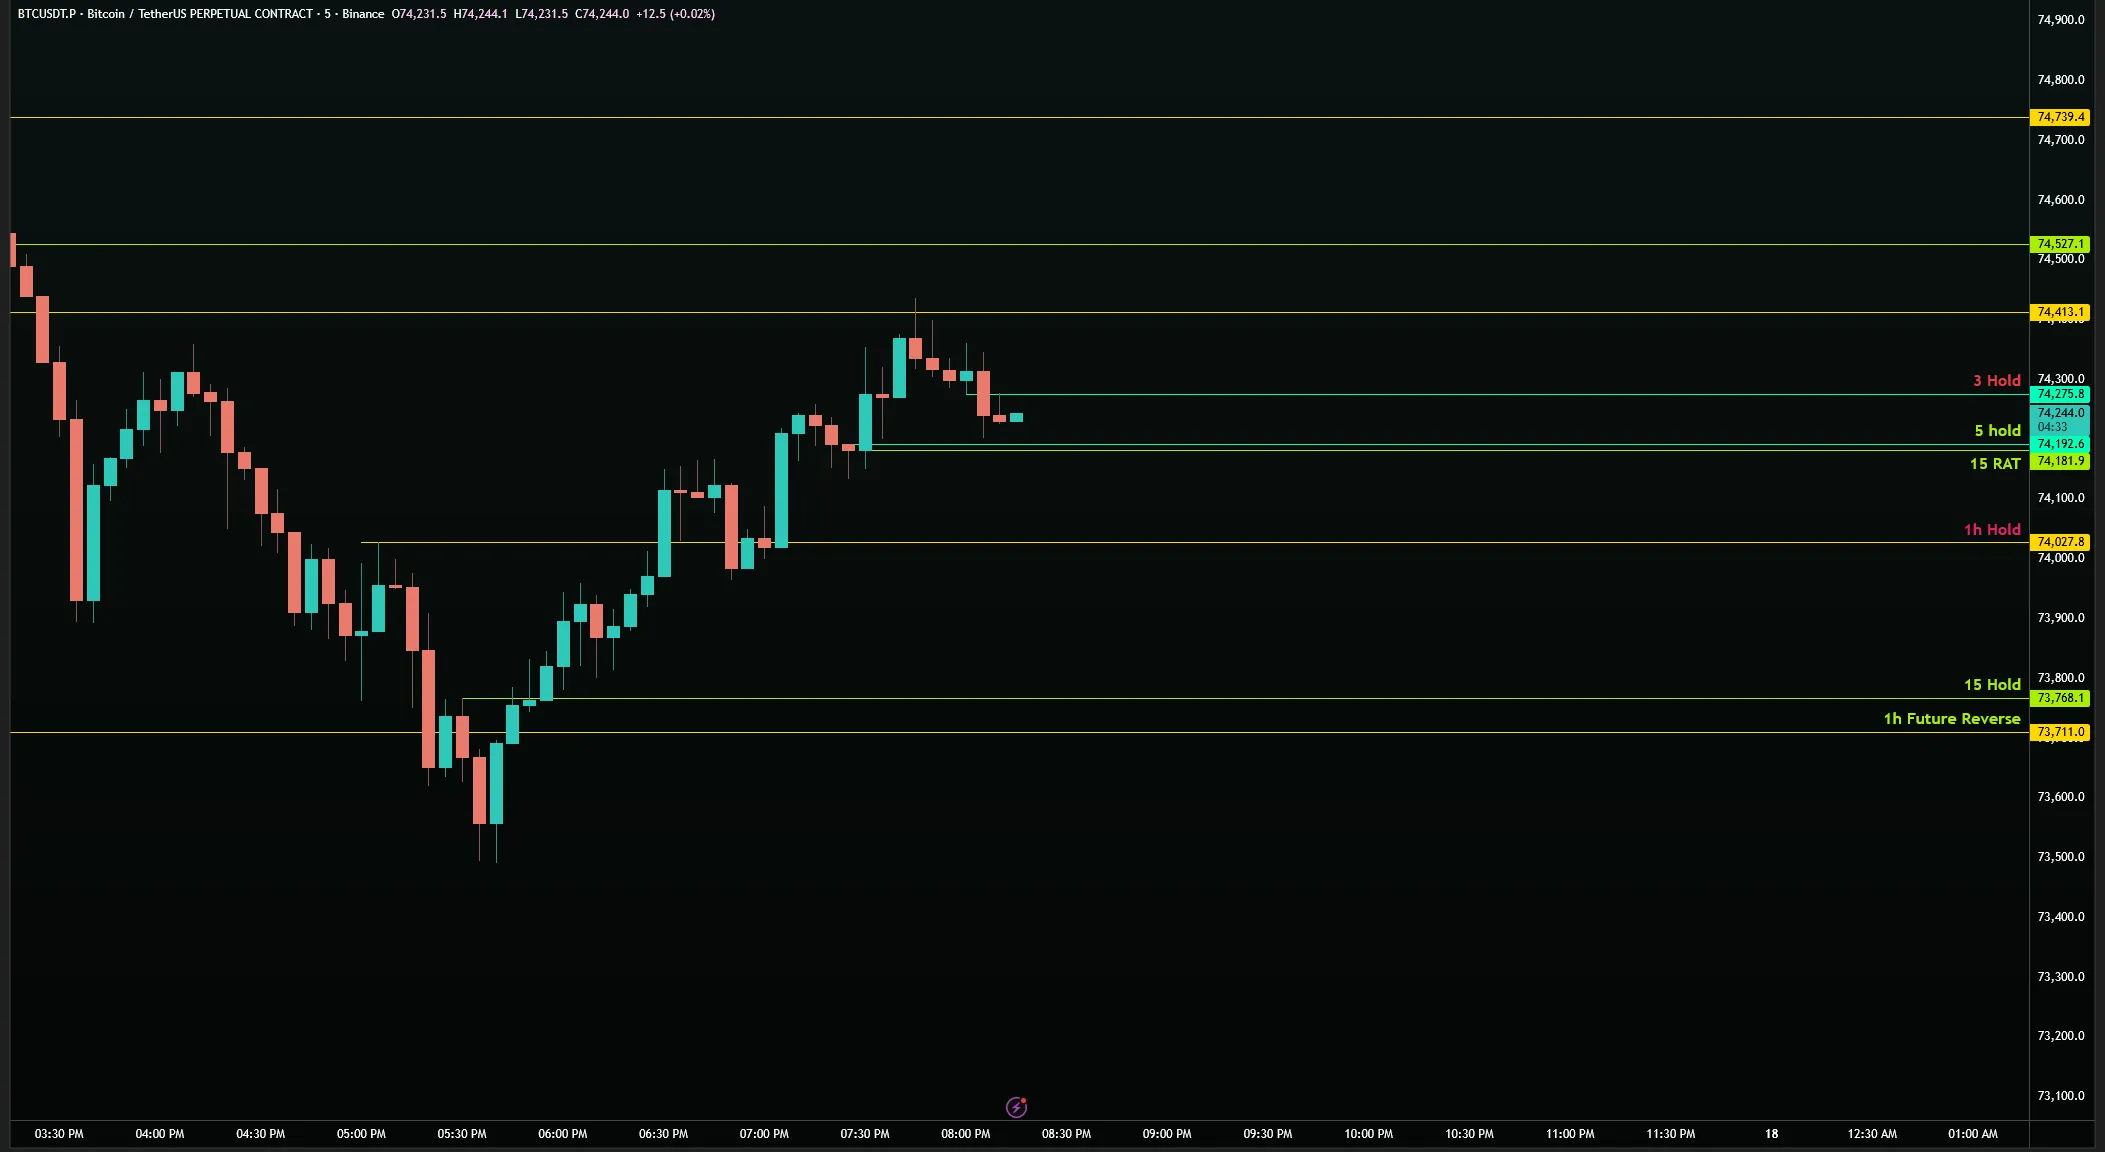
When evaluating whether to remove a level mid-trade using +1/-1: ask whether the level's timeframe is still in the active offsetting chain. If the chart has gained a four-hour level and is now working at the daily level, the 15-minute levels that were protecting the four-hour position are no longer the primary structural concern. They can be removed or archived. The current focus is the four-hour and hourly levels protecting the daily move.
Hard Closes are another trigger for level removal — but only for the specific level that was hard-closed. When a candle Hard Closes a level on its own timeframe, that level is removed and replaced by the body of the closing candle as the new Hold Level at that position. The exchange is one-for-one: the old level out, the new level (defined by the hard close candle body) in. The chart is updated to reflect the new structural reality created by the Hard Close.
Deep Dives — where price goes through a level without Hard Closing — do not trigger removal. The level stays. After a Deep Dive, the level's context changes: it becomes a potential Reverse Level candidate when it receives a second independent test. Mark it with the appropriate notation. Do not remove it prematurely just because price went through it once. Deep-dive levels are some of the highest value future targets precisely because they have been tested once without being Hard Closed.
The goal of continuous level management during a trade is a clean, current chart. A chart cluttered with tested, expired, or structurally irrelevant levels is a chart that will produce confused analysis. The best active-trade charts have only the levels that matter for the next two to three moves. Everything else is removed. Cleanliness of the chart is not aesthetic preference — it is functional accuracy. You can only act on what you can clearly see.
39 - Exterior polarity
Exterior Polarity is the deciding factor: when we are going to be breaking the current Range of the charts, and is the offsetting nature of constantly having Nested Elements inside of each other giving us direction? Monitoring every level and decision may feel cumbersome but with practice and time it'll become second nature. The end of the Logic Flow section leaves us with the most valuable piece of information that cycles us right back to the first lesson in this series — How can we see the number 1 in 1-12. I'll leave you with the most important part of this section as a reminder to perfect the first step in Logic Flow.
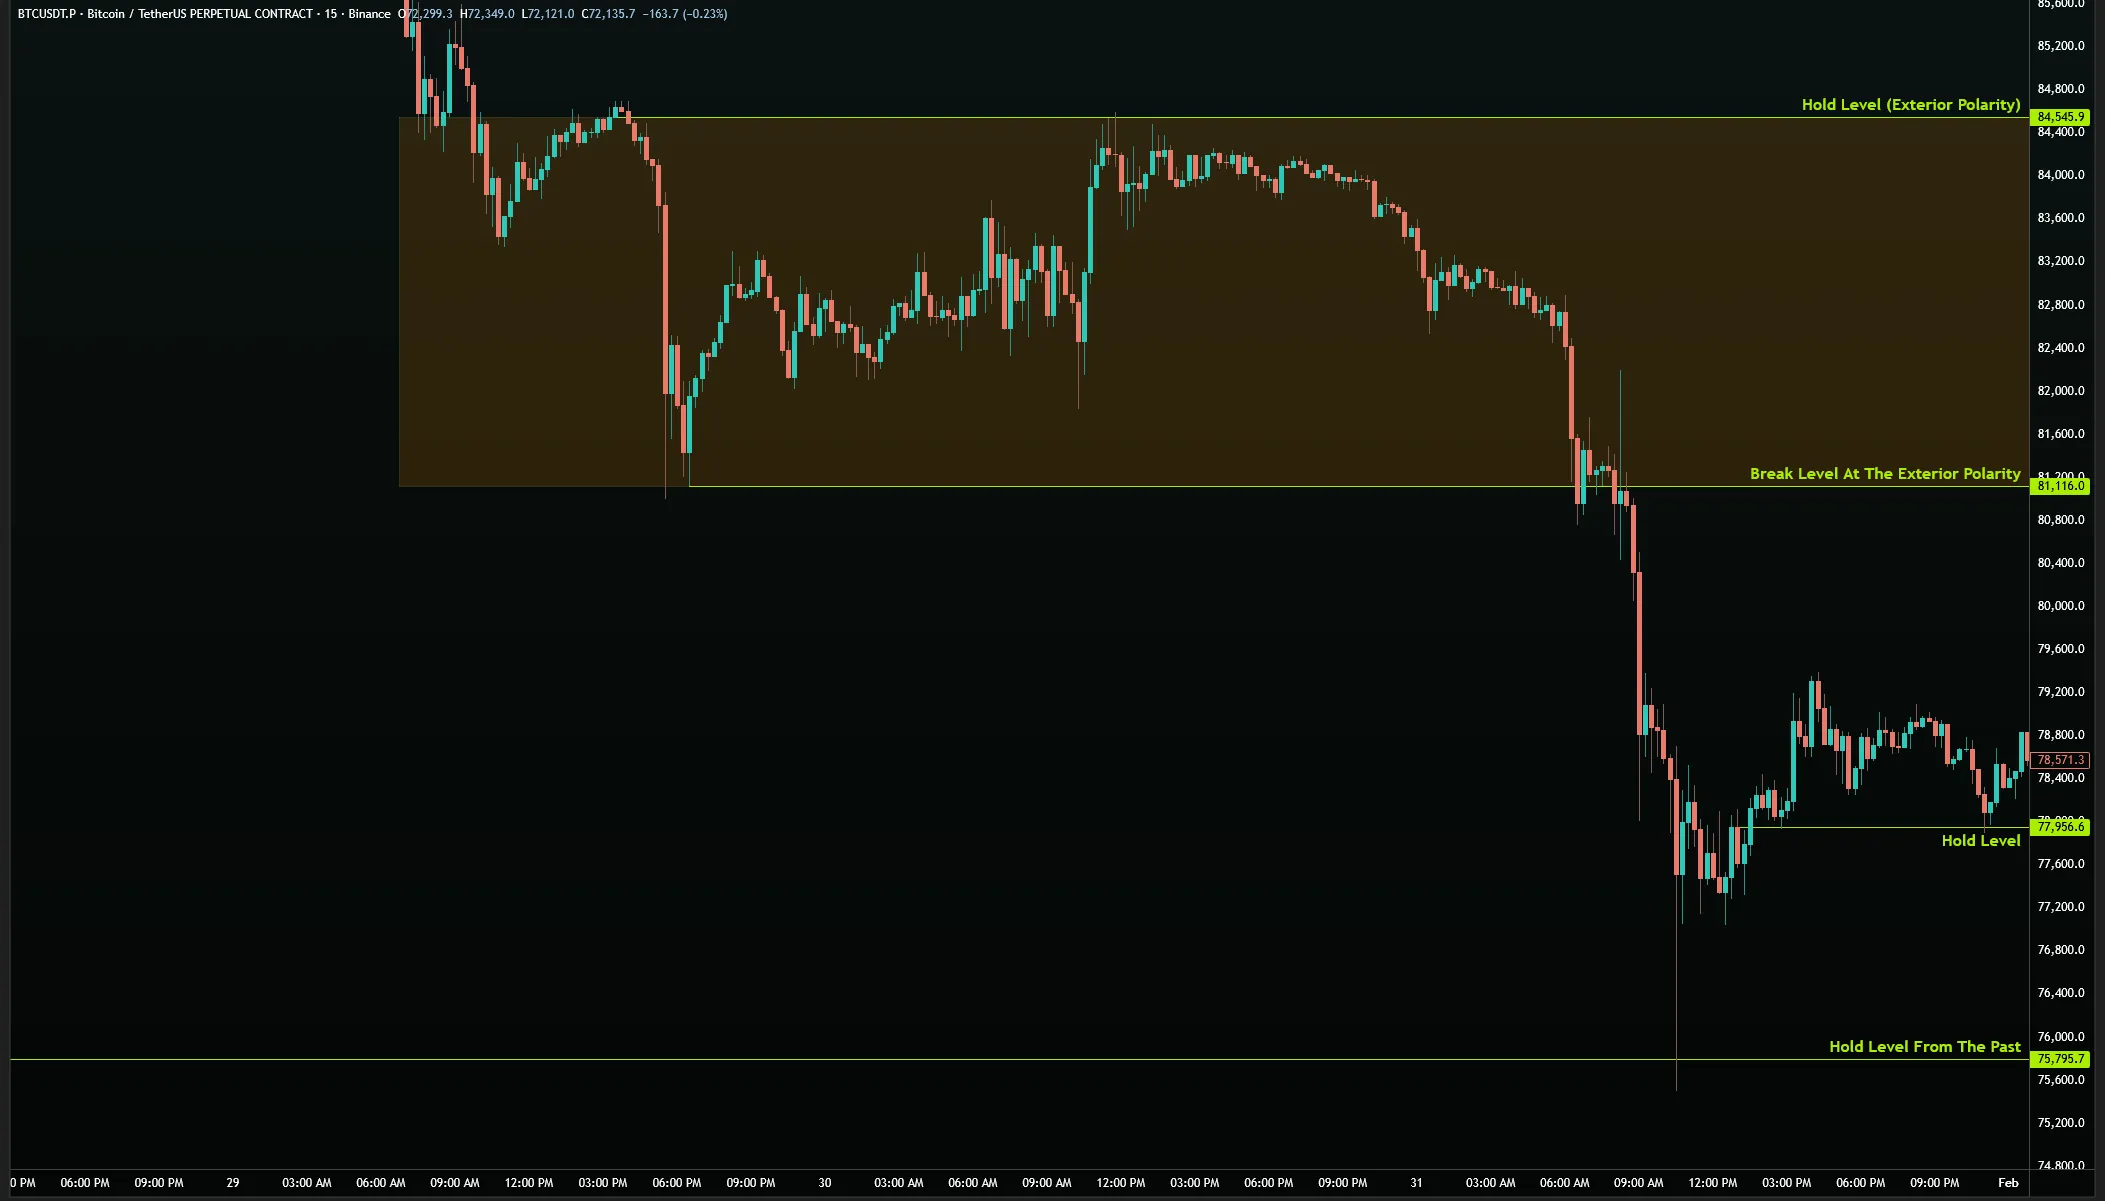
Exterior polarity refers to the polarized levels at the boundaries of the current range — the outermost structural divisions that define where the current move can ultimately go. These are not the same as interior polarity points, which exist within the range and help define sub-range direction. Exterior polarity defines the range itself: the top and bottom of the current trading environment that, when broken, sends price into an entirely different range context.
Finding exterior polarity requires working outward from current price to the first significant polarized level in each direction. This is the same as Step 1 of Logic Flow in terms of structural identification, but applied specifically to finding where the chart is structurally bounded. The exterior polarity on the top side is the first origin level, Reverse Level, or polarized range boundary above current price. The exterior polarity on the bottom side is the first such level below current price.
When a trade is approaching the exterior polarity boundary, the nature of the trade changes. At interior levels, the trade is managing the sequential offset chain — gaining timeframe by timeframe within the range. At exterior polarity, the question is binary: will the exterior polarity break (sending price into the next outer range) or will it hold (sending price back into the current range from the polarity boundary)?
Exterior Polarity breaks produce some of the largest moves in any chart. When an Exterior Polarity level breaks, price escalates either to the next range, or one timeframe above the polarity level it just broke. That escalation targets the next significant level at the elevated timeframe — which may be substantially far from current price. The concentrated structural energy at an Exterior Polarity level, when released by a break, produces moves whose size is proportional to the timeframe of the broken polarity.
At exterior polarity, the entry decision must be approached differently from interior range entries. Interior entries work within a defined range with clearly defined targets. Exterior polarity entries must account for the possibility of a major timeframe escalation if the polarity breaks, or for a significant reversal if the polarity holds. Both outcomes are large. Use triggers and shields that are calibrated for this higher variability — entries that are too tight will be stopped out by the normal volatility at a polarity boundary.
Identifying the minimum target when approaching exterior polarity: the minimum is the Pandora's Box boundary on the other side of the polarity. If exterior polarity is the top boundary of the current range, the minimum target after breaking it is not an arbitrary distance — it is the first significant untested level at the elevated timeframe. That level defines the floor of the new Pandora's Box that exists above the broken polarity.
Exterior polarity also defines where the chart re-enters the current range if the polarity holds and price reverses. When exterior polarity holds and price is rejected back into the range, the first interior polarity point in the reversal direction becomes the immediate target. The holding of exterior polarity sends price to the first available interior target in the opposing direction — creating the clear short (or long) entry at the polarity boundary itself.
40 - Skill check
We're going to do everything from +1/-1, Combo Levels, Hard Closes — everything — and we're going to start marking things. This skill check is a self-assessment to see if you're ready for the introduction into the final part of this course. The three Comparative Analysis lessons are just the opening into Comparative Analysis — there's much more to learn in Comparative Analysis outside these next three lessons. If you're finding difficulty passing your skill test go to the drills section and practice!
The skill check exists to give you an honest self-assessment of where your proficiency currently stands across all the material covered in this course. It is divided into stages. The first stage covers the core six from Section One: Hold Levels, Break Levels, origin levels, trends, range trends, and rejection as target. The second stage covers the Section Two add-ons. Completing both stages gives you a concrete picture of which skills are solid and which need additional development.
For the first stage of the skill check: take any chart, on any asset, on any timeframe. Without looking at the answers here, mark Hold Levels at the bottom of all visible valleys and the top of all visible peaks. Identify the Break Levels — the two-or-more consecutive candle runs at the extremes of moves. Identify any origin levels — Break Levels that have been independently tested twice. Mark any visible trends and range trends. Note any active RATs.
Self-evaluate using these criteria: Are all your Hold Levels at the body of the deepest same-color candle? Are your Break Levels at the first candle in the consecutive run, not the deepest? Are your Origin Levels marked as dashed lines with the elevated timeframe noted? Are your trends connected to the proper base and reach points? Are your Range Trends meeting the dual criteria of being Hold Levels with break-level candle structure at each touch?
You are ready to proceed past Section One when you can mark a complete Section One analysis in under three minutes on any chart, with no significant errors in level identification, without needing to reference notes. Speed matters here not because trading is rushed but because at this level of mastery, the marks should be reflexive — you should see them immediately rather than searching for them. If you are still searching, the foundation needs more drilling.
For the second stage of the skill check: take a chart you have already marked with Section One levels. Now add the Section Two add-ons. Label all origin levels with their plus-one timeframe. Identify any Reverse Levels and label them. Apply the master-controller designation to the range. Mark any Pandora's Box states. Note where Combo Levels would exist in the chains leading to your major levels. Identify where triggers and shields would be set on any active trade setup you see.
The second stage skill check reveals the depth of your add-on fluency. Common gaps at this stage: forgetting to apply plus-one when marking origins, treating Reverse Levels as regular Hold Levels without noting their elevated timeframe, not identifying Pandora's Box states because the two sides look superficially different in price, and setting trigger and shield levels based on feeling rather than on specific structural logic.
Address any gaps identified in the skill check by returning to the specific lesson covering that concept, reviewing it, and then immediately drilling it on a fresh chart. Do not move to Logic Flow or Comparative Analysis until the core six and the add-ons can be applied cleanly and quickly without error. Logic Flow compounds every error from prior stages. A foundation with gaps will collapse under the weight of the Logic Flow framework placed on top of it.
41 - CA 1-3
The first thing we need to do in Comparative Analysis when we are looking at the charts is to use all our Logic Flow information to start confirming what we know to be true. We verify the timeframe, we apply Technical Analysis, and we set our stops as our start to Comparative Analysis.
Logic Flow is everything we do before entering a trade. It's all of the information that you would want to go and mark up on your charts. Comparative Analysis is everything we do once a trade starts.
Comparative Analysis (CA) is the management layer of the system — everything that happens after you enter a trade. Where Logic Flow is everything before the trade, Comparative Analysis is everything during it. CA provides a one-through-nine system for managing the trade from entry to exit, responding to structural changes as they occur in real time.
The core distinction: Logic Flow ends when you enter the trade. Comparative Analysis begins the instant the trade is live. The preparation done in Logic Flow gives you the structural context. Comparative Analysis uses that context as the baseline and compares it against what is actually happening as the trade develops. Every deviation from the expected path is a comparison event — something to be analyzed and responded to.
Step 1 of Comparative Analysis: Verify the exact timeframe that was hit when price reached your entry level. This means going to the lower timeframes and confirming precisely what timeframe level price actually tested. If you entered on a 15-minute Combo Level, confirm at the five-minute and three-minute that the 15-minute was indeed what was tested, and not just the five-minute or three-minute independently. The timeframe that was actually hit determines what your trade is: the size of the move it represents, and what the controller for that move is.
Step 2: Apply the technical analysis to what was just hit. Given the timeframe confirmed in Step 1, identify the structural context: what does this level being tested mean for the chart? Is a hold here a confirmation of the larger move? Is a break a confirmation of a directional shift? What are the immediate RATs and Hold Levels that now define the path forward? The technical application in Step 2 creates the structural map that the trade will be managed against.
Step 3: Adjust the stop loss. This is the first immediate action after entry verification. The initial stop loss set in Logic Flow was based on pre-trade analysis. Now that the trade is live and you have confirmed the timeframe that was hit, the stop loss may need to be updated to more precisely reflect the trade's current structural context. The new stop is set at the appropriate trigger level for the confirmed timeframe — not at the pre-trade assumption, but at the structurally correct position given the actual entry event.
Steps 1 through 3 of Comparative Analysis — verify timeframe, apply TA, adjust stop — should be completed within the first one to two candles after entry. If you are still completing these steps when the trade has moved significantly, you have entered the reactive state: responding to price action rather than managing against a structural framework. The discipline to complete CA Steps 1–3 immediately after entry, before price moves substantially, is what separates structural management from emotional management.
The purpose of the one-through-nine CA system, like the one-through-twelve Logic Flow system, is to provide a sequential protocol that ensures nothing critical is missed. Without a protocol, active trade management becomes reactive — you respond to whatever is most visually prominent rather than working through the analysis systematically. With the protocol, each step has a specific output that feeds the next step, and no step is skipped regardless of how the trade is performing.
Comparative analysis continues for the life of the trade. As new candles form, as levels are tested, as conditions are met or broken, the CA cycle restarts. Each significant structural event — a new Hold Level created, a Break Level tested, a polarity level approached — triggers a fresh assessment of what timeframe was involved, what it means structurally, and whether the stop and target need to be updated. The trade is alive and its management must be equally alive and responsive.
42 - CA 4-6
This stage is the heart of Comparative Analysis — it's the steps that separate pros from aspiring traders. It is critical that as you do your 4-6 you are using every piece of Logic Flow and Technical Analysis you have. Hold Levels, RATs that prevent them from being created, Exterior Polarity that can interact locally. There's a large amount of considerations — every past step comes into play in steps 4-6 of Comparative Analysis.
Steps 4 through 6 of Comparative Analysis focus on target management and the progressive adjustment of the trade parameters as the trade develops. By this point, the entry has been confirmed (Steps 1–3), the structural map is established, and the trade is moving. Steps 4–6 ensure that you are continuously updating your targets and structural markers as new information arrives.
Step 4: Update the Hold Levels. As the trade progresses and new candles form, new Hold Levels are created at the advancing front of the move. Each new Hold Level is a structural marker for where the support of the trade now lives. The previous Hold Level may have been at the entry price; the current Hold Level may be 0.5% higher as price has advanced. Updating Hold Levels in real time ensures that your shield logic is always based on the most current structural position, not the original entry structure.
Step 5: Update the targets. As the trade advances and levels are tested, original targets may be reached, or new structural information may reveal better targets. If the original target level has been hard-closed by the advancing move, the target must advance to the next untested level of the appropriate timeframe. If the move has exposed a new combination of levels — a previously invisible origin level that has gained polarity — the target may shift to account for this new structure. Targets are not fixed; they are the current expression of what the structure says the move can reach.
Step 6: Apply conditions. As the trade evolves, specific conditions define what must remain true for the trade thesis to stay valid. A key condition at this stage is typically: "the most recently created Hold Level must hold." If the advancing move is building a staircase of Hold Levels, each step up is a new condition. If one step breaks — if a recently-created Hold Level fails — the condition triggers a reassessment. Does this break the thesis? Does it merely require a target adjustment? Has the trade reached its structural limit?
At Steps 4–6, the goal is progressively tightening the trade toward its structural conclusion. As price advances, shields move up, targets sharpen, and conditions become more specific. A trade that has moved 2% should not still have a 2% stop. The shield should have moved to capture most of that gain. The target should be refined to the specific next level rather than the general range boundary identified in Logic Flow. The trade becomes more precise as it advances, not more uncertain.
One of the key skills in Steps 4–6 is reading the trade's tempo against the structural expectations. A move that is progressing cleanly — testing the right levels, creating new Hold Levels as expected, hitting targets in sequence — is confirming the trade. A move that is choppy, that keeps returning to the same levels without advancing, that is failing to create new Hold Levels — is questioning the trade. Tempo reading at this stage is about detecting whether the structural thesis is being confirmed or eroded in real time.
Steps 4–6 are the heart of Comparative Analysis. The entry was defined in Logic Flow. The future management (Steps 7–9) handles the end game. Steps 4–6 are the active management phase — where the trade lives, breathes, and either develops toward its target or reveals its structural limits. The discipline required here is equal parts technical (continuously updating levels, targets, and conditions) and emotional (resisting the urge to either exit early when the trade is working correctly or hold too long when conditions have deteriorated).
43 - CA 7-9
This final session on Comparative Analysis is the first step into understanding how we use Comparative Analysis. Just like Logic Flow starting with 1-12, and then advancing into the sub-skills to master Logic Flow — Comparative Analysis has the same structure. We learn Comparative Analysis 1-9, and then we master each step with all new information and ways to use it. The drills used thus far are all focused on Logic Flow. This lesson completes Version 1 of c0tt0nc4ndyta's Day Trading Decoded. In version 2 we'll get new drills, new lessons, and new ways to master Comparative Analysis.
Steps 7 through 9 of Comparative Analysis cover the end game of the trade — the phase where the trade is approaching its target, decisions about profit-taking are active, and the final exit strategy is being executed. These steps require the most experience to master because they involve judgment calls about when a trade has reached its structural limit versus when it has temporary resistance before continuing.
Step 7: Evaluate the final approach to the target. As price nears the target level identified in Logic Flow (and possibly refined in Steps 5–6), the analysis shifts to evaluating whether the target level will hold or be broken. The assessment is conditions-based: under what conditions will the target level hold — meaning price reverses and the trade is complete? Under what conditions will it break (meaning the trade may have further to run)? Both possibilities must be pre-defined at this step.
Step 8: We decide on exits. The decision is a judgment call informed by the structural analysis. If the target level is a significant polarity point — an Origin or Reverse Level with high structural weight — the probability of a meaningful reversal at that level is high, then a full exit is appropriate. If the target level is a minor Hold Level with limited structural weight, a closer Shield may be appropriate to realize more profits while reducing downside risk. The decision is always structural — based on the weight of the level being approached — not based on profit size or fear.
Never exit based purely on how much profit you have accumulated. The correct exit trigger is structural: a level has been reached, the trade has achieved what the structure said it could achieve, and the conditions for the thesis are no longer in place. Exiting at a random profit percentage because "that feels like enough" is the same error as entering at a random price. Structure defines both entry and exit.
Step 9: Execute the final exit and document the trade. When the structural conditions for exit are met — either the target is reached and held, the final shield triggers, or the trade conditions have been definitively broken — execute the exit. After the exit, document: what was the entry, what was the exit, what was the structural thesis, was the thesis confirmed or broken, what did the trade demonstrate about the structural analysis, and what (if anything) should be applied differently next time.
Post-trade documentation is not optional. It is how improvement in Comparative Analysis is built. The recurring patterns in post-trade documentation — the same type of entry error repeated, the same type of exit too early or too late — are the specific skills to drill. Without documentation, each trade is isolated and no skill compound builds. With documentation, the pattern of errors becomes visible and addressable.
Comparative Analysis as a complete framework — Steps 1 through 9 — represents the full life cycle of a trade from entry to exit to documentation. Logic Flow (Steps 1–12) before the trade and Comparative Analysis (Steps 1–9) during the trade together form a complete protocol for managing any trade from initial chart analysis to final exit. Mastery of both is the operational expression of everything taught in this course applied in real time to real market conditions.
— WRAP UP
Congratulations on completing Version 1 of Day Trading Decoded by c0tt0nc4ndyta. Stay tuned for Version 2 where we expand on new lessons for Comparative Analysis, new Drills, and the further development of Day Trading Decoded. Now it's time to go on www.chartraiders.com and download Chart Raiders so you can play the world's first Gamified Day Trading experience. Skill Based Fantasy Trading.
Drill — +1/-1
Build speed and precision in identifying when levels gain or lose a timeframe. This drill trains your eye to instantly read the +1/-1 relationship of any level on any chart — knowing what breaks it, what equalizes it, and what holds it.
Skills Developed
Open any chart on any asset and any timeframe. Do not pre-select — the point is to practice on unfamiliar territory. Mark all visible Origin Levels first: Break Levels that have been tested twice with candle separation.
For each level, immediately label the +1 timeframe — one step up from where it was created. Then identify the -1 — one step down, which represents what would offset it. Write both labels directly on the chart.
Work at increasing speed. Start with 2 minutes per chart markup, then reduce to 1 minute, then 30 seconds. Speed comes from genuine fluency — not from skipping steps. If accuracy drops below 90% at a given speed, stay at that speed until it recovers.
Self-check: if you placed a +1 label on a level that has not been tested at the higher timeframe, remove it. Every label must be structurally justified — the plus-one must be reachable from the level's actual position in the Nested Elements chain.
Drill variation: on a live chart in progress, use only the +1/-1 framework to predict the next level interaction before it happens. Watch whether price respects the -1 offset or breaks toward the +1. Document your prediction and the outcome.
In this drill, if you place a +1 label on a level that has not been tested at the higher timeframe — remove it. Every label must be structurally justified. Speed without accuracy is not the goal. Accuracy that becomes fast is.
Drill — Combo Levels
Build speed in cascading down through the timeframe chain from a higher-level target to its deepest valid entry. This drill makes Combo Level identification automatic — you will know the moment a chain disconnects before you finish marking it.
Skills Developed
Select a 4H or daily level on any chart. This is your starting point. Mark it — do not rely on memory.
Cascade down: 4H → 1H → 15M → 5M → 3M → 1M. At each step, find the level directly below current price that continues forward and down. Label each one.
Identify the first disconnection — where the next level down is backward in time or skips a timeframe. Mark that level as your deepest valid Combo Level entry.
Drill variation: find the Combo Level for both sides simultaneously — top and bottom of the same range. The two combo chains define the full entry structure of that range.
Time yourself. First attempt: no time limit. Second: 3 minutes. Third: 90 seconds. Speed comes from recognizing the chain pattern, not from rushing.
The moment a level in the chain is backward in time or breaks the forward-and-down rule — the chain stops there. Do not continue past a disconnection. The deepest valid level before the disconnect is the entry.
Drill — Feedbacking 1-4
Train the discipline of staying at the exterior timeframe range during Steps 1–4 of Logic Flow without inadvertently entering the interior analysis of Steps 5–8. This drill enforces the boundary between exterior and interior analysis.
Skills Developed
Set up any chart. Your task: complete Steps 1–4 of Logic Flow exclusively at the daily and 4H timeframes. Do not open any smaller timeframe at any point during this phase.
Mark all exterior levels, define the range boundaries, identify the ladder points, and mark masters and controllers — all at 4H or daily only. When done, stop.
Review your markup. If any level or label on your chart came from a timeframe smaller than 4H, it is a feedback violation. Remove it and start again.
After three clean completions with zero feedback violations, deliberately introduce one: go to the 1H mid-way through Steps 1–4. Notice how it pulls your analysis inward before the exterior picture is complete.
The goal of feeling that pull is to recognize it in live trading. Once you can feel the moment you're about to feedback, you can choose to stay at the exterior instead.
Steps 1–4 are exterior analysis only. If you find yourself on a timeframe smaller than your master range controller during Steps 1–4 — you are in a feedback loop. Return to the exterior and finish before going inward.
Drill — Feedbacking 5-8
Train active and deliberate feedback looping during Steps 5–8 of Logic Flow. Unlike Steps 1–4, Steps 5–8 require you to move between timeframes constantly — this drill builds that active cross-referencing as a habit.
Skills Developed
Begin with a chart that has Steps 1–4 complete. Now complete Steps 5–8. Every time you mark a level on one timeframe, immediately go one timeframe below and verify it is untested.
If the level is tested at the lower timeframe, remove it. If untested, keep it and continue. Track every removal with a tally.
After completing Steps 5–8, count: how many levels were removed during verification versus how many survived? A well-executed drill removes at least 30% of initially marked levels.
Repeat with a different chart. Compare your removal rate. If it is consistently below 20%, you are not verifying deeply enough. If it is above 60%, your initial markup is too aggressive.
Drill variation: run Steps 5–8 on a chart where you deliberately mark without verifying first. Then run the verification pass. The difference in the chart before and after verification is the visual payoff of this skill.
Every level in Steps 5–8 must be verified at the timeframe below before it is finalized. A level that appears valid at the 15M but has been tested at the 5M is not a valid entry level. Verification is not optional.
Drill — Forward and Down
Develop automatic recognition of the forward-and-down rule within a Combo Level chain. After this drill, disconnections will be visible before you finish marking — the chain either flows or it doesn't, and your eye will know which immediately.
Skills Developed
Take any 4H level. Without looking ahead at the result, cascade: 4H → 1H → 15M → 5M → 3M → 1M. At each step, the next level must be both forward in time AND lower in price (for a short) or higher (for a long).
The moment a level is disconnected — stop. A disconnection is when there's no level to mark when you enter a timeframe down, which is also your deepest valid entry. Mark it clearly.
Common error to watch for: a candle that is forward in time but the same price — this is not a disconnection, it continues the chain. Do not stop there. Only stop when there's no level to mark.
Run this drill on 10 different levels across different timeframes and assets. Track your accuracy: were your disconnection calls correct when you reviewed the full chain?
Speed target: after 20 repetitions, you should be able to identify a disconnection within 5 seconds of arriving at the problematic timeframe.
Every level in the cascade must be forward in time and directionally consistent. Same price continuing forward is not a disconnection. Backward in time or wrong direction — stop there. The entry is the level before it.
Drill — Hold Levels
Develop instant recognition of Hold Level location — the body of the deepest same-color candle in a consecutive run. This drill trains your eyes to find the exact price of a Hold Level without hesitation, at any timeframe, on any chart.
Skills Developed
Open a fresh chart. Without pause or playback, mark every Hold Level visible on screen. The emphasis on no-pause marking trains your eyes to pick up Hold Levels at speed — the same speed required in live trading.
For each Hold Level marked, identify: is it front-side (approached from below for a green hold, or above for red) or back-side (already tested from the opposite side)? Label each one.
Self-check: is every Hold Level on the body of the deepest same-color candle in its run? If any are on a wick, move them. We should always train for body interaction first, and then check wicks after.
Drill variation: mark Hold Levels in slow-playback mode on a live chart. As each candle forms, immediately identify whether it is creating a new Hold Level, extending an existing one, or neither.
Speed target: within 30 seconds of opening any chart, you should be able to mark all visible Hold Levels accurately. This is the baseline fluency required for all downstream skills.
A Hold Level can be on the body, or the wick. For efficiency reasons we first mark bodies and then move to wicks as this trains us to recognize Combo Level possibilities.
Drill — Inverse Levels
Build simultaneous top-side and bottom-side awareness. Every Hold Level on one side of the range has a corresponding level on the opposite side. This drill trains you to see both halves of the range structure at once, creating a complete structural picture.
Skills Developed
Start with a clean chart. Mark all bottom-side Hold Levels. After each one, immediately locate and mark the inverse (top-side) Hold Levels at the corresponding structural position.
Check each pair: are they the same timeframe? If yes — that is a Pandora's Box. Mark it. If they are at different timeframes — they are Offsets. The gap between them defines the range width at that level.
Drill variation: find any two Hold Levels — one on top, one on bottom — where price is currently between them. Predict: which side will price test first? Document your prediction and the result.
Advanced: mark all inverse pairs on a 4H chart. Then drop to the 15M. Do the inverse pairs at the 4H create Combo Level chains that converge at the same price? If yes, that convergence is a significant structural entry zone.
Speed target: for every Hold Level you mark, the inverse should be found and labeled within 10 seconds.
Every Hold Level has an inverse. If you can only see one side of the range, your structural picture is incomplete. A Pandora's Box exists when inverse levels share the same price — this is one of the most significant structural states on any chart.
Drill — Origins
Develop speed and precision in identifying Origin Level creation the moment it occurs. The critical transition — when a Break Level becomes an Origin Level after its second independent test — is a real-time recognition skill that must become automatic.
Skills Developed
Watch for Break Levels. Count tests: first independent test — still a Break Level. Candle with separation, second independent test — Origin Level created. Mark the exact moment of conversion.
The moment an Origin Level is created, immediately identify: (1) the elevated timeframe it now operates at, (2) the -1 timeframe Hold Level that protects it after it is created, (3) what level can attack it in the future.
Drill extension: after identifying an Origin, build the Combo Level chain from it. The Origin is the anchor — the combo chain cascades downward from it.
Common error: marking a level as an Origin after only one test. One test = Break Level. Two independent tests with candle separation = Origin Level. No exceptions.
Speed target: within 5 seconds of a second test completing, you should have the Origin Level's elevated timeframe identified.
An Origin Level requires exactly two independent tests with candle separation. One test is a Break Level. Three tests makes it a Reverse Level candidate. The two-test threshold is precise — do not round up or down.
Drill — Right to Left
Train your eyes to read chart structure from the most recent candle backward into history — rather than reading history forward to the present. This drill changes your chart-reading orientation from historical narrative to current-state analysis.
Skills Developed
Open any chart. Place your cursor on the rightmost visible candle. From that candle, work leftward — identifying the most recent Hold Level, the most recent Break Level, the most recent Origin, and the current range boundary.
Record each in order of recency: what is the most recent structural event? Second most recent? Third? The three most recent levels define the current structural context more accurately than any level from deeper history.
Do not let your eye drift to the left side of the chart first. If you catch yourself reading left-to-right, start over. The habit this drill breaks is deeply ingrained — it takes repetition to override.
Advanced version: time yourself. Starting from the rightmost candle, how quickly can you identify the three most relevant levels on the chart? Target: under 20 seconds. Elite: under 10. (TIP: Relevant means that in the future those levels were respected with extreme precision.)
Drill variation: cover the left two-thirds of the chart with a blank area. Read only the rightmost third. When done, uncover the rest and verify your structural read against the historical context.
The most recent Hold Level is more relevant to the current trade than a Hold Level from three weeks ago. Right-to-left reading prioritizes the structural reality of now. Historical levels provide context — recent levels provide direction.